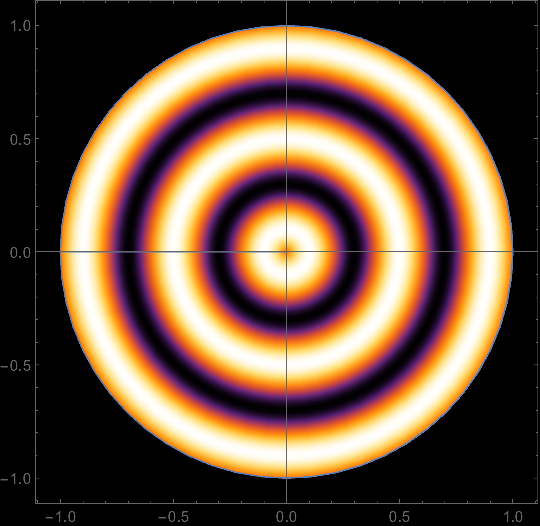
I have a function $Q(y)$, which I would like to plot this radially using varying color shades to show the variation in the function. I'm looking for a 2D surface plot, maybe like DensityPlot, but circular and versus one parameter ($y$). An example use case would be plotting the angular velocity of a galaxy with color, assuming that it is radially symmetric.
You can assume an arbitrary $Q(y)$, e.g. $1/y^2$. Now for each $y$, we have a value for $Q(y)$. One way to show the results is to plot $Q(y)$ vs. $y$. But I would prefer if I can have a circular plot where for each $y$ there is a ring where $y$ is constant. I would like the color of this ring to be determined by the value of $Q(y)$.


PolarPlot? $\endgroup$PolarPlotisn't what you're looking for, do you have an example of what kind of plot you're trying to make? $\endgroup$DensityPlot[Q[Sqrt[x^2+y^2]], {x, -5, 5}, {y, -5, 5}], assuming that $0 \le r \le 5$ is an appropriate range for your plot? $\endgroup$f = r \[Function] 1/2 (1 + Sin[5 Pi r]); ParametricPlot[ r {Cos[t], Sin[t]}, {r, 0, 1}, {t, -Pi, Pi}, ColorFunction -> {{x, y, r, t} \[Function] ColorData["SunsetColors"][f[r]]}, Background -> Black ]$\endgroup$