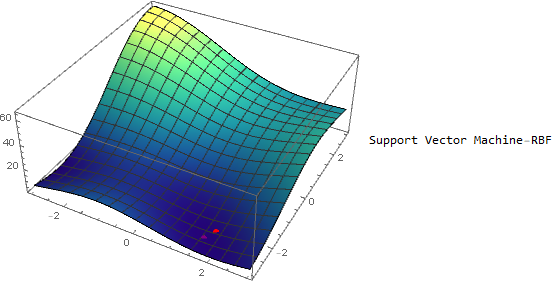
I was following the examples given in the BayesianMinimization documentation and I found that this function actually does not give me the minimal value (very close though). Can anyone help explain the reasons behind this issue?
The problem can be reproduced by the following codes (following the documentation):
sampletest =  RandomSample[ExampleData[{"MachineLearning", "FisherIris"}, "Data"]];
trainingsample = sampletest[[1 ;; 100]];
validationsample = sampletest[[101 ;;]];
And then define a loss function in terms of the two hyperparameters and parameter space for optimization:
lossSVMRBF[{c_, gamma_}] := Module[
 {class},
 class =
 Classify[trainingsample,
  Method -> {"SupportVectorMachine", "KernelType" ->
              "RadialBasisFunction", "SoftMarginParameter" -> Exp[c],
     "GammaScalingParameter" -> Exp[gamma]}];
  -ClassifierMeasurements[class, validationsample, "LogLikelihood"]
 ];
reg2 = Rectangle[{-3., -3.}, {3., 3.}];
Conduct the Bayesian minimization:
boSVM = BayesianMinimization[lossSVMRBF, reg2]
The minimum configuration and minimum value can then be obtained by
boSVM["MinimumConfiguration"]
and
boSVM["MinimumValue"]
On my computer, the minimum configuration and minimum value with exactly the same code are {1.74,-2.2} and 2.15, respectively.
Similarly, I also plot the predictor function and the minimal point given by BayesianMinimization (the red point)
pSVM = boSVM["PredictorFunction"]
pt2 = {Append[boSVM["MinimumConfiguration"], boSVM["MinimumValue"]]};
Show[
 Plot3D[pSVM[{x, y}], {x, -3, 3}, {y, -3, 3}, ColorFunction -> "BlueGreenYellow", PlotLegends -> "Support Vector Machine-RBF", Exclusions -> False, PlotRange -> All],
 ListPointPlot3D[pt2, PlotStyle -> Directive[Red, PointSize[Large]]]
]
Visually there are points lower than the red point, so I used FindMinimum[pSVM[{x, y}], {x, 1.5}, {y, -2.0}] to search around the minimal point, and get a lower point when c= 1.56839, gamma=-2.51149 and the value is 1.55825 (the purple point in the above figure).

