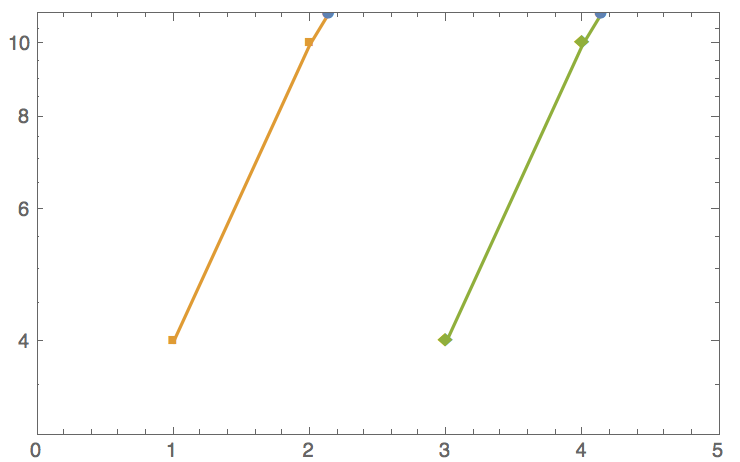
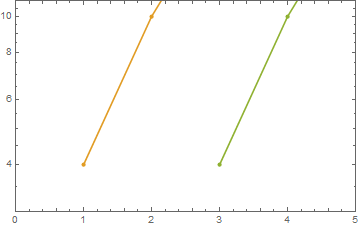
Consider the following example
ListLogPlot[{{Null}, {{1, 4}, {2, 10}, {3, 20}}, {{3, 4}, {4, 10}, {5,
 20}}}, PlotRange -> {{0, 5}, {3, 11}}, Joined -> True, PlotMarkers -> Automatic, Frame -> True, Axes -> False]
in Mathematica 10.2 it results in the following plot with different colours for the two top points. How can this be fixed?


Frame->False, Axes->True. Those points should not be there. I use macOS 10.13.4, in a iMac Intel i3. I suggest you contact support. $\endgroup$