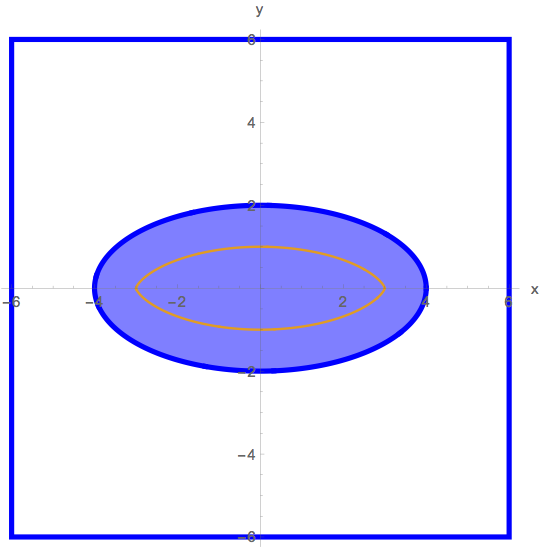
You are the chief engineer at the Badger Steel Plate Company in Madison, Wisconsin. In comes an order for 750 square steel plates, each measuring 12 inches wide and 12 inches long.
Go to the drawing board
plate = Graphics[{Blue, Thickness[0.01], Line[{{-6, -6}, {-6, 6}, {6, 6}, {6, -6}, {-6, -6}}]}];
plateplot = Show[plate, Axes -> True, AxesOrigin -> {0, 0}, AspectRatio -> Automatic, AxesLabel -> {"x", "y"}]
But here's the kicker:
The plates are to have everything inside the ellipse $(x/4)^2 + (y/2)^2 = 1$ cut out.
Take a look:
Clear[x, y, t];
x[t_] = 4 Cos[t];
y[t_] = 2 Sin[t];
hole = ParametricPlot[{x[t], y[t]}, {t, 0, 2 Pi}, PlotStyle -> {{Blue,
Thickness[0.01]}}];
Show[plateplot, hole]
You have a new robotic router that takes instructions from Mathematica and whose cutting center can be programmed to follow any curve you tell it to follow. If you are going to use a bit 1 inch in diameter, then what curve should you program in as the path of the center of the router to cut out the ellipse?
After you have found the correct curve, add its plot to the plot above.
Big Tip:
If your curve is an ellipse, then you screwed up.
The normal vector D[unittan[t], t] could be very useful.
Here's what I have tried;
filling =
  Plot[{-Sqrt[16-x^2]/2, Sqrt[16-x^2]/2}, {x, -4, 4},
    PlotStyle -> {{Blue, Blue}},
    Filling -> Axis,
    FillingStyle -> Directive[Opacity[0.5],Blue]];
Show[plateplot, hole, filling]
and it fills the inside,
x[t_] = 0.5 Cos[t];
y[t_] = 0.5 Sin[t];
P[t_] = {x[t], y[t]};
router =
  ParametricPlot[{x[t], y[t]}, {t, 0, 2 Pi}, PlotStyle -> {{Blue, Thickness[0.01]}}];
Show[plateplot, hole, router, filling]
This is as far as I got, but the shaded region is to be cut out of the plate and I'm stuck on how to do that. The bit of the router is the cutting tool. This does not refer directly to the hole that is to be cut.

