0
$\begingroup$

enter image description hereI can figure out how to plot this for calc 3.

Question:

a) Plot the circle of radius 3 centered at the point $\{-1, 1, 1\}$ in the plane whose xyz-equation is $2(x + 1) + 3(y - 1) + (z - 1) = 0$. Include in your plot a big enough piece of the plane to accommodate the circle.

My answer:

We are given:

  • Radius = $3$
  • Center = $\{-1, 1, 1\}$

Then:

$2(x + 1) + 3(y - 1) + (z - 1) = 0$ so

$2x + 2 + 3y - 3 + z - 1 = 0$ so

$2x + 3y + z = -2 + 3 + 1$ so

$2x + 3y + z = 2$

Thus: Normal = $\{2, 3, 1\}$

Equation of line:

$r(t) = \{-1, 1, 1\} + t \{2, 3, 1\}$

Equation of plane:

$2x + 3y + z = 2$ so

$\left(x + \frac{3}{2}y + \frac{z}{2}\right) = 1$

So we can find that the:

  • x intercept = $1$
  • y intercept = $\frac{2}{3}$
  • z intercept = $2$

How can I plot this?

b) Here's a plot of a spiral in the xy-plane:

Clear[spiral, t];
spiral[t_] = {t Cos[2 t], t Sin[2 t]};
ParametricPlot[spiral[t], {t, 0, 3 Pi}, AxesLabel -> {"x", "y"}]

Use your answer to part a) above to help plot a true scale duplicate copy of this spiral on the plane with xyz-equation $2(x + 1) + 3(y - 1) + (z - 1) = 0$. Center your spiral at $\{-1, 1, 1\}$ and include in your plot a big enough hunk of the plane to accommodate the spiral.

How do I plot this?

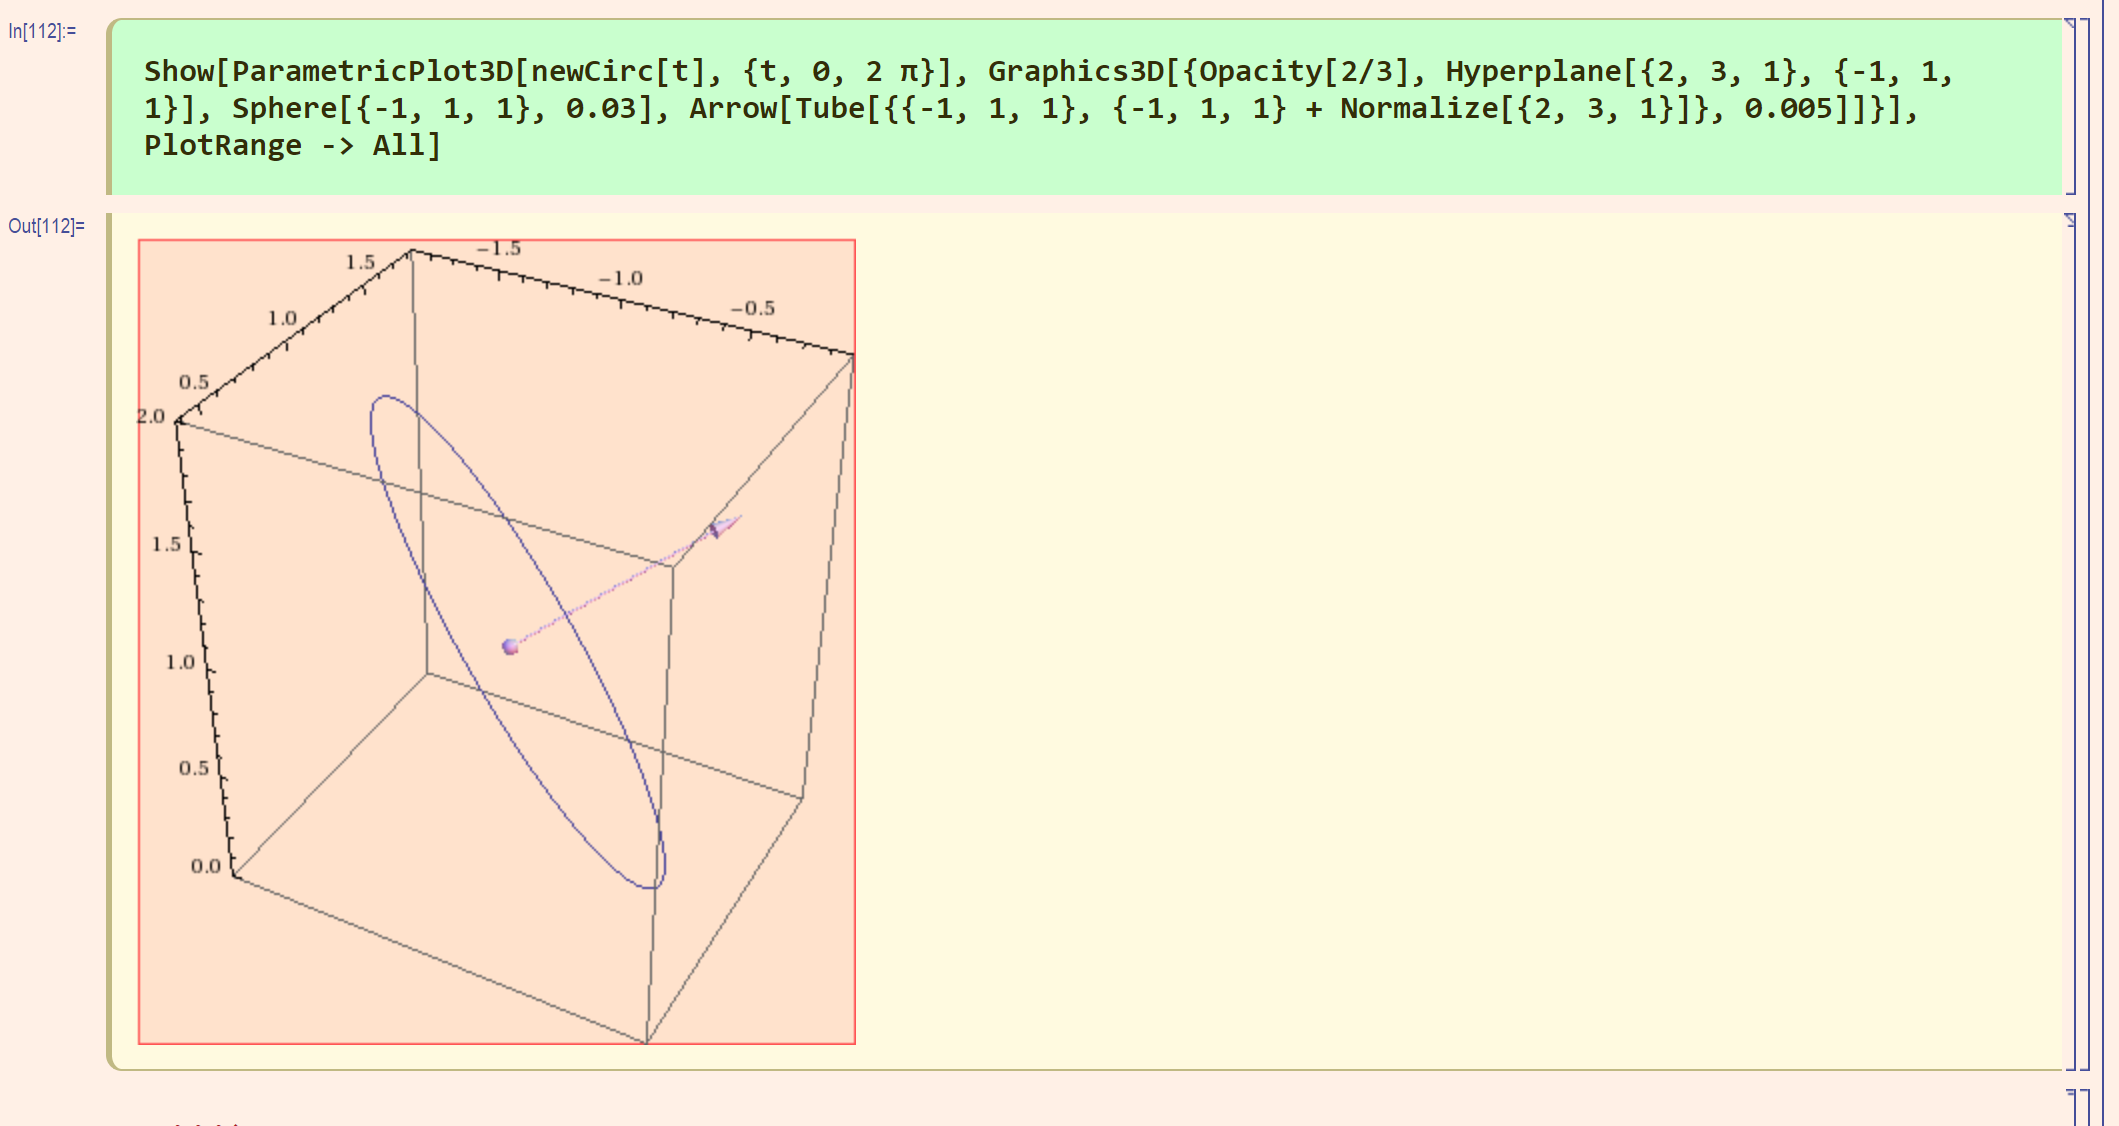
The image is what I have tried.

$\endgroup$
1
  • $\begingroup$ What have you tried? Where are you stuck? $\endgroup$
    – anderstood
    Commented Mar 21, 2018 at 2:31

1 Answer 1

2
$\begingroup$

I'll teach you how to do part 1; the method for part 2 is completely analogous.

Note that the equation for your plane is already in Hessian form; you now know that the plane passes through $(-1,1,1)$ and has the normal with components $\langle2,3,1\rangle$. If you start with the parametric equation of a circle of radius $3$ in the $x$-$y$ plane:

circ[t_] := {Cos[t], Sin[t], 0};

then you can derive the equation for the embedded circle as

newCirc[t_] = {-1, 1, 1} + RotationTransform[{{0, 0, 1}, {2, 3, 1}}][circ[t]];

To show that the circle derived fits the bill:

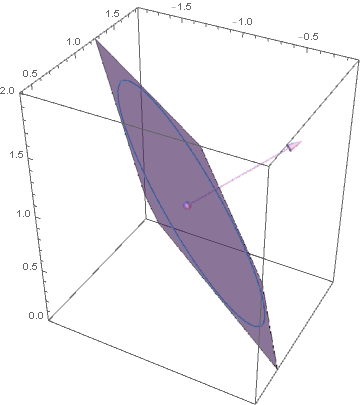
Show[ParametricPlot3D[newCirc[t], {t, 0, 2 π}], 
     Graphics3D[{Opacity[2/3], Hyperplane[{2, 3, 1}, {-1, 1, 1}], Sphere[{-1, 1, 1}, 0.03],
                 Arrow[Tube[{{-1, 1, 1}, {-1, 1, 1} + Normalize[{2, 3, 1}]}, 0.005]]}],
     PlotRange -> All]

circle on a tilted plane

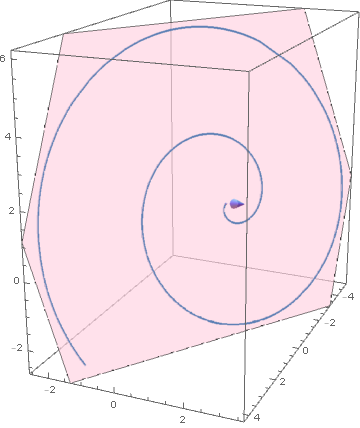
As I said, part 2 is up to you; you just need to do a similar procedure for your spiral. You should be able to get a picture like this:

spiral on a tilted plane

$\endgroup$
6
  • $\begingroup$ Okay so i tried that (refer to picture of your code in my question above) and it didn't give me the plane! :( $\endgroup$ Commented Mar 21, 2018 at 3:22
  • $\begingroup$ What version of Mathematica are you using? $\endgroup$ Commented Mar 21, 2018 at 4:25
  • $\begingroup$ It's called mathable. its for my online class. "With the cooperation of Wolfram Research, we created Hilbert Mathematica, an online version of Mathematica. Hilbert has been integrated with custom online learning management tools to become Mathable." doesn't say what version $\endgroup$ Commented Mar 21, 2018 at 4:51
  • $\begingroup$ Can you try evaluating $Version to see what it returns? $\endgroup$ Commented Mar 21, 2018 at 5:18
  • $\begingroup$ Hilbert::disallowedsym: No symbol in the list {$Version} is allowed to be used as input to Hilbert. $\endgroup$ Commented Mar 21, 2018 at 5:22

Not the answer you're looking for? Browse other questions tagged or ask your own question.