41
$\begingroup$

In an attempt to squeeze more plots and controls into the limited space for a demo UI, I am trying to remove any extra white spaces I see.

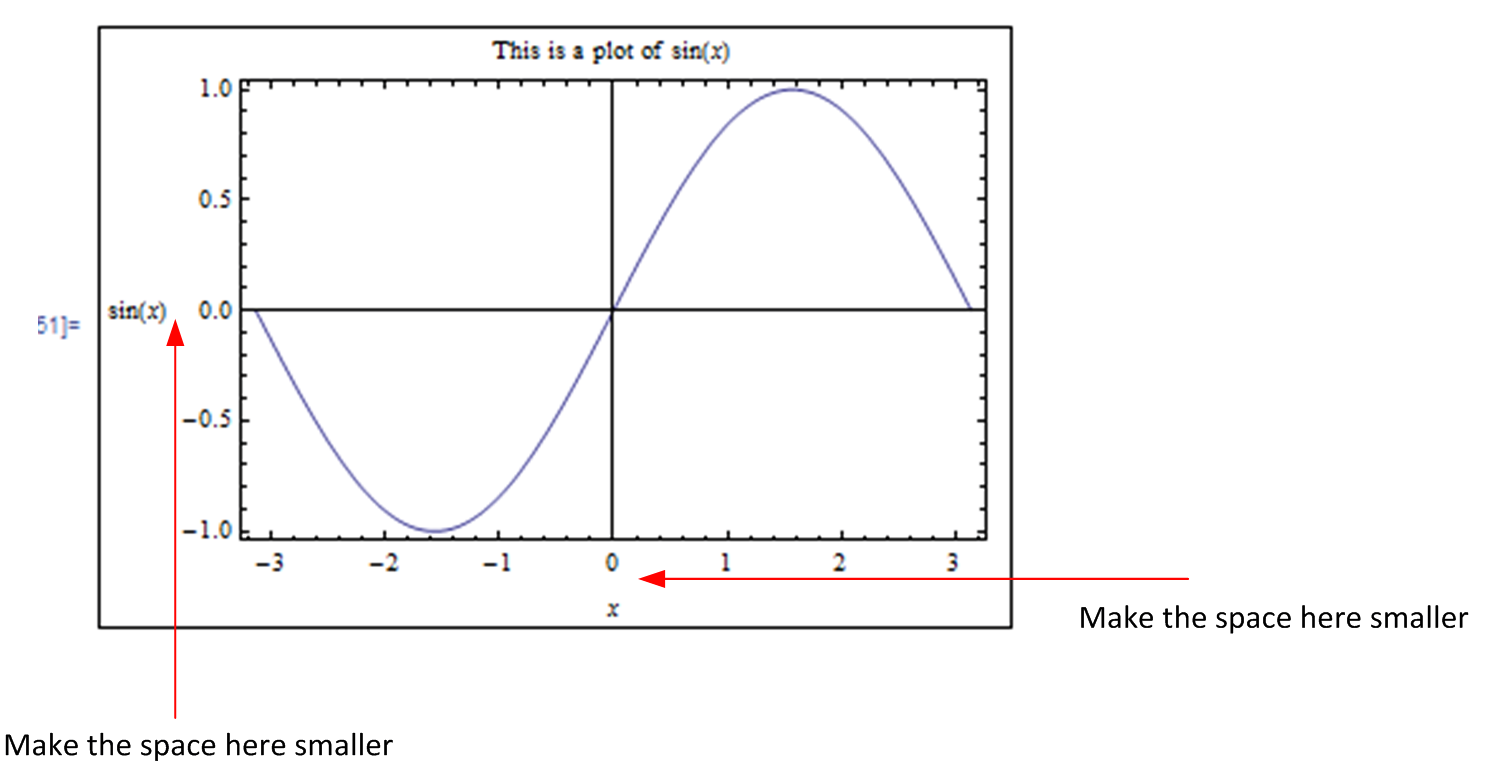
I am not sure what options to use to reduce the amount of space between the ticks labels and the actual text that represent the labels on the axes.

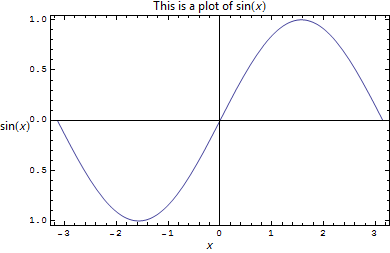
Here is a small Plot example using Frame->True (I put an outside Frame as well, just for illustration, it is not part of the problem here)

Framed[

 Plot[Sin[x], {x, -Pi, Pi},
  Frame -> True,
  FrameLabel -> {{Sin[x], None}, {x, 
     Row[{"This is a plot of ", Sin[x]}]}},
  ImagePadding -> {{55, 10}, {35, 20}},
  ImageMargins -> 0,
  FrameTicksStyle -> 10,
  RotateLabel -> False
  ],

 FrameMargins -> 0
 ]
Mathematica graphics

Is there an option or method to control this distance?

Notice that ImagePadding affects distance below the frame label, and not between the frame label and the ticks. Hence changing ImagePadding will not help here.

Depending on the plot and other things, this space can be more than it should be. The above is just a small example I made up. Here is a small part of a UI, and I think the space between the t(sec) and the ticks is too large. I'd like to reduce it by few pixels. I also might like to push the top label down closer to the plot by few pixels also.
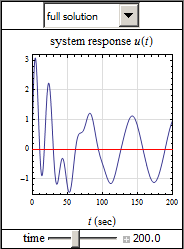
Mathematica graphics

I am Using V9 on windows.

update 12/22/12

Using Labeld solution by @kguler below is a good solution, one just need to be little careful with the type-sitting for the labels. Plot automatically typeset things as Text in TraditionalFormat, which is a nice feature. To do the same when using Labeled one must do this manually using TraditionalForm and Text as well.

Here is example to show the difference

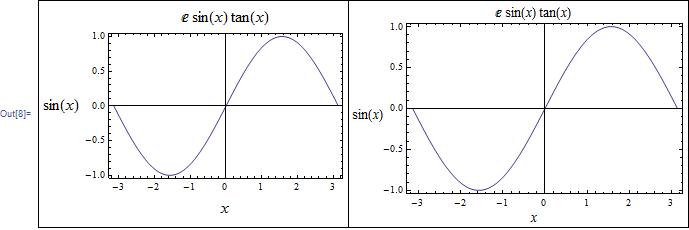
1) Labeled used just with TraditionalForm. The left one uses Plot and the right one uses Labeled with TraditionalForm. Notice the difference in how labels look.

Grid[{
  {

   Plot[Sin[x], {x, -Pi, Pi}, Frame -> True, 
    FrameLabel -> {{Sin[x], None}, {x, E Tan[x] Sin[x]}}, 
    ImageSize -> 300, FrameTicksStyle -> 10, FrameStyle -> 16,RotateLabel -> False],

   Labeled[
    Plot[Sin[x], {x, -Pi, Pi}, Frame -> True, ImageSize -> 300], 
    TraditionalForm /@ {Sin[x], x, E Tan[x] Sin[x]}, {Left, Bottom, Top}, 
    Spacings -> {0, 0, 0}, LabelStyle -> "Panel"]
   }

   }, Frame -> All]

Mathematica graphics

2) Now we do the same, just need to add Text to get the same result as Plot.

Grid[{
  {
   Plot[Sin[x], {x, -Pi, Pi}, Frame -> True, FrameTicksStyle -> 10, 
    FrameStyle -> 16, 
    FrameLabel -> {{Sin[x], None}, {x, E Tan[x] Sin[x]}}, 
    ImageSize -> 300, RotateLabel -> False],

   Labeled[
    Plot[Sin[x], {x, -Pi, Pi}, Frame -> True, ImageSize -> 300], 
    Text /@ TraditionalForm /@ {Sin[x], x, E Tan[x] Sin[x]}, {Left, 
     Bottom, Top}, Spacings -> {0, 0, 0}, LabelStyle -> "Panel"]
   }

   }, Frame -> All]
Mathematica graphics

Update 12/22/12 (2)

There is a big problem with controlling the spacing.

Labeled spacing only seem to work for horizontal and vertical spacing, taken togother.

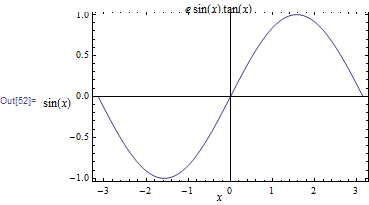
i.e. One can't control spacing on each side of the plot separately? Here is an example, where I tried to move the bottom axes label up, this ended with moving the top label down as well. Which is not what I want.

Labeled[Plot[Sin[x], {x, -Pi, Pi}, Frame -> True, ImageSize -> 300], 
 Text /@ TraditionalForm /@ {Sin[x], x, E Tan[x] Sin[x]}, {Left, 
  Bottom, Top}, Spacings -> {-.2, -0.7}]
Mathematica graphics

Will see if there is a way to control each side spacing on its own. Trying Spacing->{-0.2,{-0.7,0}} does not work, it seems to take the zero in this case and ignored the -0.7

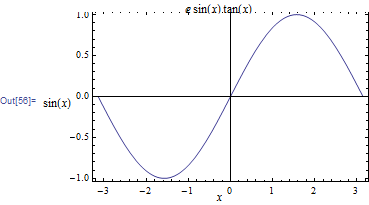
This gives the same result as above:

Labeled[Plot[Sin[x], {x, -Pi, Pi}, Frame -> True, ImageSize -> 300], 
 Text /@ TraditionalForm /@ {Sin[x], x, E Tan[x] Sin[x]}, {Left, 
  Bottom, Top}, Spacings -> {-.2, -0.7, .0}]
Mathematica graphics

ps. there might be a way to specify the spacing for each side with some tricky syntax. I have not figured it out yet. Still trying thing.... http://reference.wolfram.com/mathematica/ref/Spacings.html

update 12/22/12 (3) Using combination of ImagePadding and Spacing should have worked, but for some reason, the top label now is cut off. Please see screen shot. Using V9 on windows
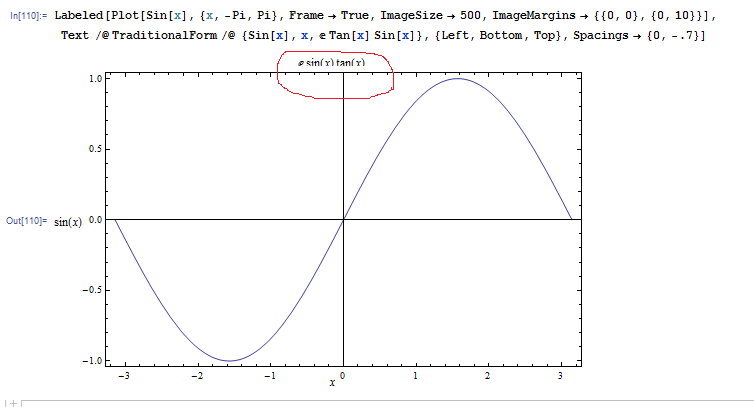
enter image description here

Note: The above seems to be related to the issue reported here: some Graphics output do not fully render on the screen until an extra click is made into the notebook

Need an extra click inside the notebook. Then label become un-chopped !

$\endgroup$
3
  • 1
    $\begingroup$ Might I suggest you migrate the second half of this post into an answer? I feel this is a fairly frequently asked question, but this post is fairly hard to parse and separate into a question and an answer. $\endgroup$ Commented May 1, 2015 at 12:49
  • 1
    $\begingroup$ @Szabolcs The methods shown in this thread can be used for this, but they seems to be even more convoluted than Emilio's approach. $\endgroup$ Commented Nov 17, 2016 at 13:08
  • $\begingroup$ You can simply add spaces before or after the text you want on the lable. E.g. if the lable is "y", you can make it "y " instead. For the other axis, instead of using "x" you can use "\n x" or "\n \n x" for adding one or two spaces before the label. Cheers! $\endgroup$
    – Nunix
    Commented Dec 19, 2017 at 20:42

4 Answers 4

35
$\begingroup$

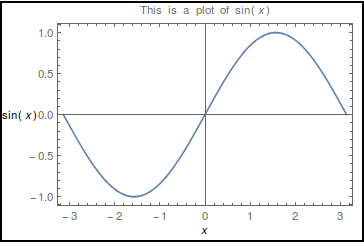
The most convenient way I found is to wrap Plot (without FrameLabels and PlotLabel and with appropriate ImagePadding and ImageMargins) inside Labeled and use the Spacings option to position the labels:

 Labeled[Plot[Sin[x], {x, -Pi, Pi}, Frame -> True, 
 ImagePadding -> {{20, 1}, {15, 2}}, ImageMargins -> 0, 
 FrameTicksStyle -> 10], 
 TraditionalForm /@ {Sin[x], x, Row[{"This is a plot of ", Sin[x]}]}, 
 {Left, Bottom, Top}, 
 Spacings -> {0, 0}, LabelStyle -> "Panel"]

enter image description here

$\endgroup$
0
17
$\begingroup$

This can also be achieved by

  • encasing the graphic inside a Show,
  • setting the outer Show's PlotRangeClipping to False, and
  • adding the labels as Text commands inside an Epilog.

Thus, for your example, you would do

Framed[
 Show[
  Plot[Sin[x], {x, -Pi, Pi}
   , Frame -> True
   , FrameLabel -> {{None, None}, {None, 
      Row[{"This is a plot of ", Sin[x]}]}}
   , ImagePadding -> {{55, 10}, {35, 20}}
   , ImageMargins -> 0
   , FrameTicksStyle -> 10
   , RotateLabel -> False
   ]
  , PlotRangeClipping -> False
  , Epilog -> {
    Text[x, {0, -1.4}],
    Text[Sin[x], {-4.12, 0}]
    }
  ]
 , FrameMargins -> 0
 ]

which produces

Mathematica graphics

You can then freely place the label text anywhere within the image box by adjusting the Text coordinates.

This has the advantage that (as far as I can tell, on v10.1.0) the resulting styling is identical to that produced by setting the labels via AxesLabel or FrameLabel; if you want to style them directly then you can do that as well.

Further, this produces an actual Graphics object, as opposed to an object with a Labeled head, which can be advantageous for manipulating and exporting the resulting plot.

Due credit to David Park's answer on this comp.soft-sys.math.mathematica thread for pointing out the technique.

$\endgroup$
9
  • 1
    $\begingroup$ +1. The key point of this technique is that Epilog (as well as Prolog) never triggers the actual plot range of Graphics (even when PlotRange->All or PlotRange->Full is specified). This feature allows to add graphics primitives outside of the plot range safely. The drawback is that you must adjust ImagePadding by hands because Epilog also does not affect image paddings even when ImagePadding -> All is specified. $\endgroup$ Commented May 2, 2015 at 0:49
  • 3
    $\begingroup$ This method is better (IMO) for many reasons; the fact that it produces a Graphics object as you say, this also means it can be made a known ImageSize, also it gets the alignment of the axes labels correct, the x is beneath the 0. You can make your code more general still by using Scaled values for the positions in the Epilog, ie replace Text[x, {0, -1.4}] with Text[x, Scaled[{0.5, -0.2}]] as you then don't need to know the PlotRange. $\endgroup$ Commented Jan 29, 2016 at 22:40
  • $\begingroup$ Is there a reason you have chosen to put the Epilog in a Show instead of simply within the Plot? $\endgroup$ Commented Jan 29, 2016 at 22:51
  • $\begingroup$ @Quantum_Oli Yes. This lets you set PlotRangeClipping to True for the plot itself. Otherwise it is not necessary. $\endgroup$ Commented Jan 30, 2016 at 4:16
  • $\begingroup$ @Emilio Pisanty, it seems to me that the value of PlotRangeClipping given in the Show overrides that given in the Plot (unfortunately). I guess it might be system dependent (I'm on 10.3 on OS X). If you take your example and set PlotRangePadding->None (so we can observe whether clipping is occurring or not) you will see that adding a PlotRangeClipping->True inside the Plot doesn't stop the plot from slightly spilling over the frame at (-pi,0). I'm wondering how to fix this.... $\endgroup$ Commented Jan 30, 2016 at 16:39
12
$\begingroup$

Another possible (partial) solution is adding negative space. This can be accomplished by putting the label in Framed and setting negative frame margins on one or mode side.

Try this:

Manipulate[
 Framed[Plot[Sin[x], {x, -Pi, Pi}, Frame -> True, 
   FrameLabel -> {{Sin[x], None}, 
     (* HERE'S THE FRAMED LABEL: *)
     {Framed[x, FrameStyle -> None, 
       FrameMargins -> {{0, 0}, {0, -space}}, 
       ContentPadding -> False], 
      Row[{"This is a plot of ", Sin[x]}]}}, 
   ImagePadding -> {{55, 10}, {35, 20}}, ImageMargins -> 0, 
   FrameTicksStyle -> 10, RotateLabel -> False], FrameMargins -> 0],
 {space, 0, 20}
 ]

Adding too much negative space will cause part of the label to be cut off.

Here's a convenience function to shift labels up (positive value) or down (negative value):

shift[space_][x_] := 
 Framed[x, FrameStyle -> None, 
  FrameMargins -> {{0, 0}, If[space > 0, {0, -space}, {space, 0}]}, 
  ContentPadding -> False]

Use it as shift[amount][label] and beware of part of the label getting cut off when the shift is not tiny!

$\endgroup$
1
  • $\begingroup$ Another issue I found with this approach is that exporting to pdf does not take into account the shifted position and places the frame label at the unshifted location. $\endgroup$
    – Oscillon
    Commented Jan 5, 2023 at 21:02
11
$\begingroup$

When using SciDraw, we have full control over all label positions. The key option names are variation on TextNudge. The value specified in this option will be added to the label position.

Example with frame labels:

Figure[
 {
   FigurePanel[{}, FrameLabel -> {x, y}, 
     XFrameTextNudge -> 10,     (* shift up by 10 pt *)
     YFrameTextNudge -> {10, 0} (* shift right by 10 pt *)
   ]
 }
]

enter image description here

SciDraw of course draws its own frames and requires working in (and learning) its own framework. It will not help in changing the position of standard frame labels.

The ability of SciDraw to move labels is one of the several reasons why I usually use it for publication figures. I you have the time and are willing to learn it, it is a good option to deal with the label positioning problem.

$\endgroup$

Your Answer

By clicking “Post Your Answer”, you agree to our terms of service and acknowledge you have read our privacy policy.

Not the answer you're looking for? Browse other questions tagged or ask your own question.