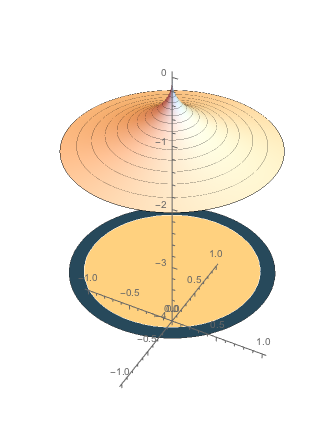
Here is a 3D hacked-together plot:
 f[x_, y_] := -(x^2 + y^2)^.2;
 min = -1;
 max = 0;
 surface =  Plot3D[f[x, y], {x, -1, 1}, {y, -1, 1}, PlotRange -> {min,   max},
ClippingStyle -> None, MeshFunctions -> {#3 &}, Mesh -> 15,
   MeshStyle -> Opacity[.5], Boxed -> False, Axes -> False,
   PlotPoints -> 200, PlotStyle ->  White];
slice = SliceContourPlot3D[f[x, y],
   z == min - 2, {x, -5, 5}, {y, -5, 5}, {z, min - 2, min + 2},
   PlotRange -> {min, max}, Axes -> True, PlotPoints -> 200,
   PlotRangePadding -> 0, Boxed -> False, PlotPoints -> 200,
   Contours -> 20, ContourStyle -> White];
Show[surface, slice, PlotRange -> All, BoxRatios -> {1, 1, 1.4},
 Axes -> True, AxesOrigin -> {0, 0, -4}]

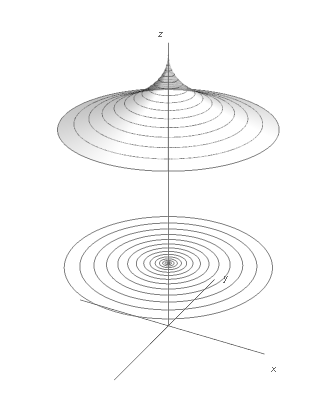
I would like to change the colors to neutral ones on the surface and its projection. Furthermore, I would like to have neater contour lines on the surface and on the projection, to have some contours in the projection where there currently are none and, finally, labels on the axes.
Surely these questions have been asked before, but I can't find them.

