0
$\begingroup$

I am having little trouble with coloring the list plot. I want to vary the color slowly.

For example, if I have data

{0,1,2,3,5,7,8,9,7,5,2,1,3,5}

I want it to be

{Red -> slowly change ->Black}

to see how it change by the iteration. Which means that 0 will be red, 5 will be black, and in between number 1 2 3////5 2 1 3 will slowly change from darker red to light black.

I have data using simple fractal pattern. I am just curious to see how the each iteration in fractal pattern moves. Maybe it might not show anything.

f[pt_] := Module[{r},
  r = RandomReal[{0, 1}];
  Which[0 <= r < 0.1, {0.05*pt[[1]], 0.5 pt[[2]]},
   0.1 <= r < 0.2, {0.05*pt[[1]], -0.5 pt[[2]] + 1},
   0.2 <= r < 0.4, {0.46*pt[[1]] - 0.15 pt[[2]], 
    0.39 pt[[1]] + 0.38 pt[[2]] + 0.6},
   0.4 <= r < 0.6, {0.47*pt[[1]] - 0.15 pt[[2]], 
    0.17 pt[[1]] + 0.42 pt[[2]] + 1.1},
   0.6 <= r < 
    0.8, {0.43*pt[[1]] + 0.28 pt[[2]], -0.25 pt[[1]] + 0.45 pt[[2]] + 
     1},
   0.8 <= r < 
    1, {0.42*pt[[1]] + 0.26 pt[[2]], -0.35 pt[[1]] + 0.31 pt[[2]] + 
     0.7}
   ]
  ]
ListPlot[NestList[f, {0.5, 0}, 10000], ImageSize -> Large, 
 PlotRange -> All, PlotStyle -> Hue[1, 1, 0.5]]

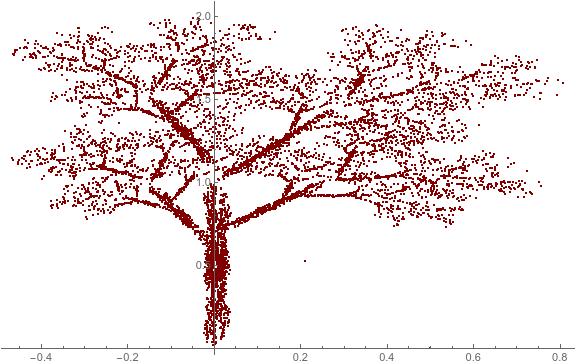
This will generate

enter image description here

I am trying to use ColorFunction, but I could not figure it out. Thank you for helping me.

$\endgroup$
1
  • $\begingroup$ See Blend $\endgroup$
    – b3m2a1
    Commented Dec 7, 2017 at 16:31

1 Answer 1

1
$\begingroup$
f[pt_] := Module[{r}, r = RandomReal[{0, 1}];
  Which[0 <= r < 0.1, {0.05*pt[[1]], 0.5 pt[[2]]}, 
   0.1 <= r < 0.2, {0.05*pt[[1]], -0.5 pt[[2]] + 1}, 
   0.2 <= r < 0.4, {0.46*pt[[1]] - 0.15 pt[[2]], 
    0.39 pt[[1]] + 0.38 pt[[2]] + 0.6}, 
   0.4 <= r < 0.6, {0.47*pt[[1]] - 0.15 pt[[2]], 
    0.17 pt[[1]] + 0.42 pt[[2]] + 1.1}, 
   0.6 <= r < 
    0.8, {0.43*pt[[1]] + 0.28 pt[[2]], -0.25 pt[[1]] + 0.45 pt[[2]] + 1}, 
   0.8 <= r < 
    1, {0.42*pt[[1]] + 0.26 pt[[2]], -0.35 pt[[1]] + 0.31 pt[[2]] + 0.7}]]

SeedRandom[0];

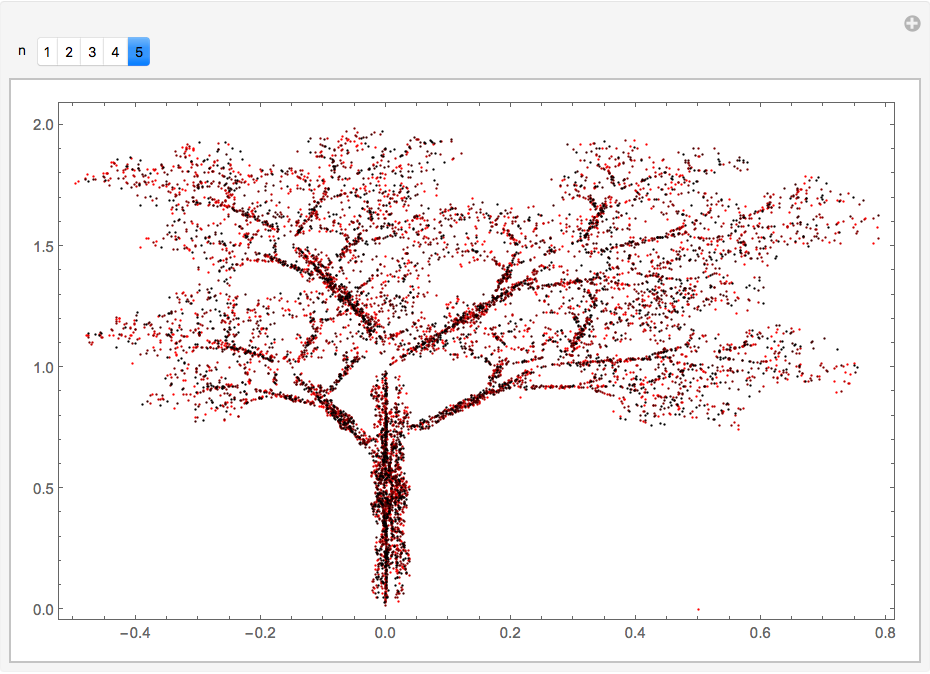
Break the data into 5 subsets of 2000 data points.

data = NestList[f, {0.5, 0}, 9999] // Partition[#, 2000] &;

Manipulate[
 ListPlot[data[[1 ;; n]],
  ImageSize -> Large,
  PlotStyle -> (Blend[{Red, Black}, (# - 1)/4] & /@ Range[5]),
  Frame -> True, Axes -> False,
  PlotRange -> All],
 {{n, 5}, Range[5]}]

enter image description here

$\endgroup$

Your Answer

By clicking “Post Your Answer”, you agree to our terms of service and acknowledge you have read our privacy policy.

Not the answer you're looking for? Browse other questions tagged or ask your own question.