3
$\begingroup$

I have a datafile with results from measurements that describe a two dimensional distribution. The file is in a contour plot format, i.e. in the first column a variable x is fixed and in column 2 y runs over its full range; column 3 contains the functional value f(x,y). Then x is increased, y runs again over the full range and so on:

x1    y1   f(x1,y1)
x1    y2   f(x1,y2)
x1    y3   f(x1,y3)
.......
x2    y1   f(x2,y1)
x2    y2   f(x2,y2)
x2    y3   f(x2,y3)
........

xn    y1   f(xn,y1)
xn    y2   f(xn,y2)
.....

The databins are very narrow and I would like to rebin them into broader bins, both in x and y. I could do this by DO loops and IFs. Is there are faster, more elegant way to do this? Here is a simple example before rebinning:

0.05      -0.95      10
0.05      -0.85       9
0.05      -0.75       7

0.10      -0.95       15
0.10      -0.85       13
0.10      -0.75       12

Here the numbers in the 3rd column give numbers of counts. The numbers in the 2nd column give the middle points of intervals, i.e. -0.9 -> -1, -0.8 -> -0.9, -0.7 -> -0.8. Now I want to increase the width of the bins in the second column from 0.1 to 0.3 and the number of counts in these new bins should be the average over the original values. Thus, the table should look like:

0.05        -0.85     26/3
0.10        -0.85     40/3

How can this be done with Mathematica built-in commands?

$\endgroup$
4
  • $\begingroup$ I'm not sure I follow. Can you give a small example of before and after, for what you'd like to accomplish? I have no doubt, however, that this could be accomplished in another manner than using Do's and If's $\endgroup$
    – ktm
    Commented Nov 27, 2017 at 18:03
  • $\begingroup$ see GatherBy . $\endgroup$
    – george2079
    Commented Nov 27, 2017 at 18:26
  • $\begingroup$ @user6014: the x-values give the middle point of a certain interval in x, same for y, and f(x,y) is really the number of counts in these intervals. All the values of x and y are equidistant. I would just like to make the intervals broader. So a set of data such as $\endgroup$ Commented Nov 27, 2017 at 19:01
  • $\begingroup$ So here is a very short numerical example (unfortunately, my data files are much larger): 0.05 -1.0 10 0.05 -0.95 8 0.05 -0.9 7 0.10 -1.0 9 0.10 -0.95 8 $\endgroup$ Commented Nov 27, 2017 at 19:36

2 Answers 2

4
$\begingroup$

There are two possibilities I can see. The first (and IMHO the best) is to use ArrayResample. Unfortunately, it doesn't do exactly what you want, and I couldn't get it to work on your small data snippet. However, I suspect it does something better, and on large data sets it gives very similar output.

The second possibility (which, unfortunately, I wrote before I knew about ArrayResample) is the function

rebin[data_, newbins_] := Map[Mean@Flatten[#, 1] &, 
  Partition[SplitBy[data, First], newbins, newbins, {1}, {}], {2}]

which gets the averaged midpoints and counts that you requested for your data. I'll explain what it does below.

Examples

First, let me give a demonstration. Suppose you have a large data set in an n × 3 array:

data = Flatten[Table[
      {x, y, IntegerPart[100 x Sin[2 π (x + y)] Cos[2 π (x - y)]]},
     {x, 0, 1, 0.01}, {y, 0, 1, 0.01}], 1];

(* The full data *)
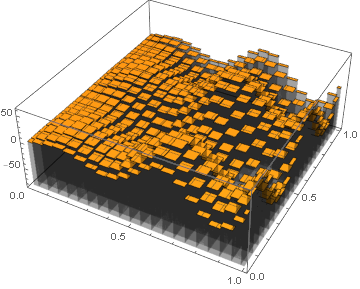
ListPlot3D[data, Filling -> Bottom, InterpolationOrder -> 0]

(* Downsampling by `rebin` *)
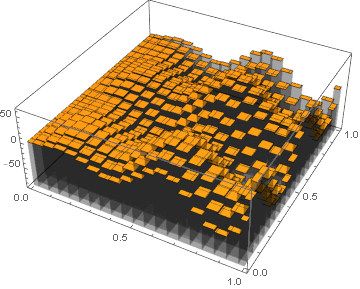
ListPlot3D[Flatten[rebin[data, {5, 5}], 1], Filling -> Bottom, 
  InterpolationOrder -> 0]

(* Downsampling by `ArrayResample` *)
ListPlot3D[
  Flatten[ArrayResample[SplitBy[data, First], {20, 20, 3}], 1], 
  Filling -> Bottom, InterpolationOrder -> 0]
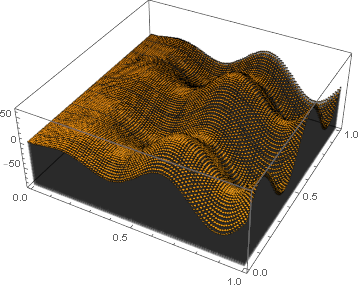
enter image description here

enter image description here

enter image description here

Clearly the outputs are very similar, but not identical. The main difference is that ArrayResample uses far more sophisticated resampling techniques than rebin.

ArrayResample can't get very far with your example data because it needs at least two sample points per dimension. With rebin we get:

data = Partition[Flatten[ImportString[string, "Table"]], 3];
rebin[data, {1, 3}]

(* {{{0.05, -0.85, 26/3}}, {{0.1, -0.85, 40/3}}} *)

General explanation of rebin

I would recommend using ArrayResample if you can. FWIW I'll go through a general example with rebin, in case it can be useful in some way. Suppose that your data looks something like this:

rawdata = Flatten[Array[{x[#1], y[#2], f[##]} &, {6, 6}], 1]

(* {{x[1], y[1], f[1, 1]}, {x[1], y[2], f[1, 2]},... , {x[1], y[6], f[1, 6]}, 
    {x[2], y[1], f[2, 1]}, {x[2], y[2], f[2, 2]},...
    ...,  , {x[6], y[5], f[6, 5]}, {x[6], y[6], f[6, 6]}
   } *)

So that Dimensions[rawdata] == {36, 3}, rather than Dimensions[rawdata] == {6, 6, 3}, as it would be without that Flatten. This is the format it will be in if you use @HenrikSchumacher's ImportString.

We want to get it into a structured format with all the x-values gathered together -- the {6, 6, 3} format above. (If it's already in this format, then great -- you can skip this). That can be done with SplitBy:

MatrixForm[
  structureddata = SplitBy[rawdata, First]
]
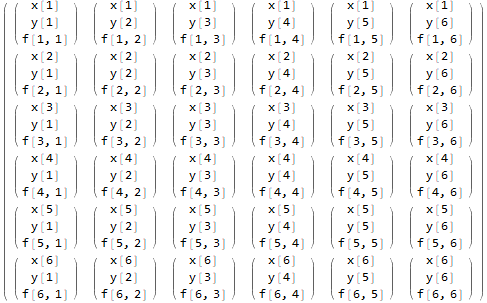
enter image description here

Now suppose that you want to rebin your data into bins twice as wide in x (so that x[1] and x[2] bins go together, x[3] and x[4], etc.) and three times as wide in y ({y[1], y[2], y[3]} are all together, {y[4], y[5], y[6]} are all together, etc.). Then we can Partition it with:

xbins = 2; ybins = 3;
MatrixForm[
  partdata = Partition[structureddata, {xbins, ybins}, {xbins, ybins}, {1}, {}]]
]
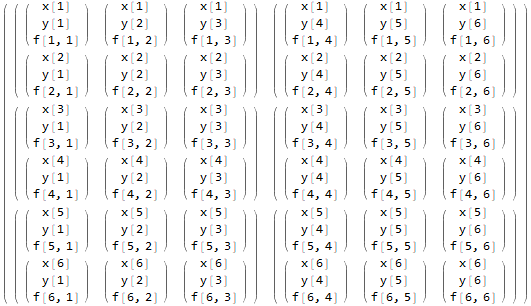
enter image description here

(I'll explain about those extra parameters in a minute).

Next, we just use Map at level 2 to take the average:

MatrixForm[
  Map[Simplify@Mean@Flatten[#, 1] &, partdata, {2}]
]

enter image description here

Those extra parameters in Partition -- the {xbins, ybins}, {1}, {} -- are in case the rebinning doesn't nicely line up with the dimensions of the data. For example, suppose we want the same rebinning, but the data doesn't fit as nicely:

rawdata = Flatten[Array[{x[#1], y[#2], f[##]} &, {7, 7}], 1]

Then those last x and y values will be rebinned by themselves:

MatrixForm[
 Map[Simplify@Mean@Flatten[#, 1] &, 
  Partition[
   SplitBy[rawdata, First], 
    {xbins, ybins}, {xbins, ybins}, {1}, {}], 
 {2}]
]

enter image description here

You still end up with the desired rebinning, but it still seems like an arbitrary decision -- why not isolate the first values? In fact there are many such problems associated with rebinning data. ArrayReshape could be your best bet for dealing with them consistently.

$\endgroup$
1
  • $\begingroup$ many thanks for this extensive answer. I will need some time to digest it. Btw: the problem I mentioned arises because a program produces output in a form suitable for making contour plots with gnuplot (my initial example). $\endgroup$ Commented Nov 28, 2017 at 15:29
3
$\begingroup$

Maybe not the most efficient solution but easy to implement. First, we import the data that you gave as a String:

string = "0.05      -0.95      10
  0.05      -0.85       9
  0.05      -0.75       7

  0.10      -0.95       15
  0.10      -0.85       13
  0.10      -0.75       12";
data = Partition[Flatten[ImportString[string, "Table"]], 3];

This results in an array of size $n \times 3$. The following will duplicate the first two entries in each row as often as the third row tells us:

pts = Flatten[Map[ConstantArray[#[[1 ;; 2]], #[[3]]] &, data], 1];

That means, pts looks probably like the orginal raw data that you have collected. Now you can use BinCounts and Histogram3D (with slightly differing syntax) to bin the data as you wish. As an example, this bins the points according to bins of size dx times dy.

xmin = -1.; xmax = 1.; dx = 0.1;
ymin = -1.; ymax = 1.; dy = 0.1;
bincounts = BinCounts[pts, {xmin, xmax, dx}, {ymin, ymax, dy}];
Histogram3D[pts, {{xmin, xmax, dx}, {ymin, ymax, dy}}]
$\endgroup$

Your Answer

By clicking “Post Your Answer”, you agree to our terms of service and acknowledge you have read our privacy policy.

Not the answer you're looking for? Browse other questions tagged or ask your own question.