I am trying to plot a set of data using ListLogLogPlot.
x = {4.*^14, 4.*^15, 4.*^16};
y = {1170, 243, 50};
data = Partition[Riffle[x, y], 2];
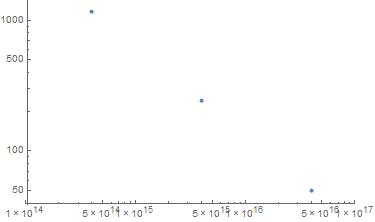
However, when I go to plot this using ListLogLogPlot, the tick labels of the x-axes do not come out well:
ListLogLogPlot[data, PlotRange -> {{1*^14, 1*^17}, Automatic}]
I understand that tick mark labels can be edited using "Ticks". So I have tried creating custom tick labels that are rotated by 45 degrees. I would like there to be a label at 1E14, 1E15, 1E16, and 1E17:
customTicks = Table[{i, Rotate[i, Pi/4]}, {i, {1.*^14, 1.*^15, 1.*^16, 1.*^17}}];
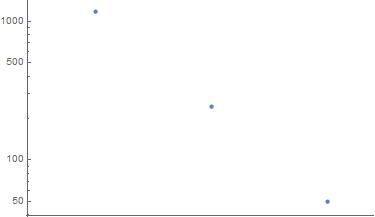
But when I update Ticks in ListLogLogPlot, the x-axis is just blank:
ListLogLogPlot[data, PlotRange -> {{1*^14, 1*^17}, Automatic}, Ticks -> {customTicks, Automatic}]
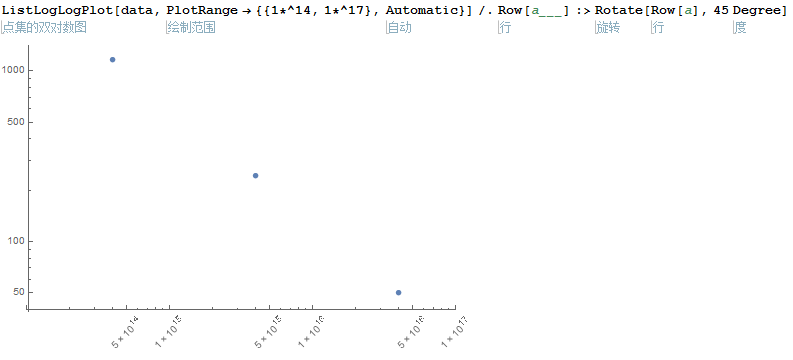
Does anyone know why the x-axis labels do now show up when rotated? Or know of a way to properly rotate the labels?
(I am a beginner with Mathematica. I have read through an earlier post on how to align rotated labels as well as the documentation on Ticks, FrameTicks, TicksStyle, however, I am unable to get the numbers to even display on the x-axis)


