4
$\begingroup$

I am trying to place a 3D arrow in a Plot3D:

g[x_, y_] := 1/(2*π*σ^2)*E^(-((x^2 + y^2)/(2*σ^2))) /. {σ -> 1};
Show[
  Plot3D[g[x, y], {x, -5, 5}, {y, -5, 5}, 
    PlotRange -> All, 
    PlotStyle -> Opacity[0.5]],
  Graphics3D[{Red, Arrow[Tube[{{0, 0, g[0, 0]}, {1, 1, g[0, 0]}}]]}]]

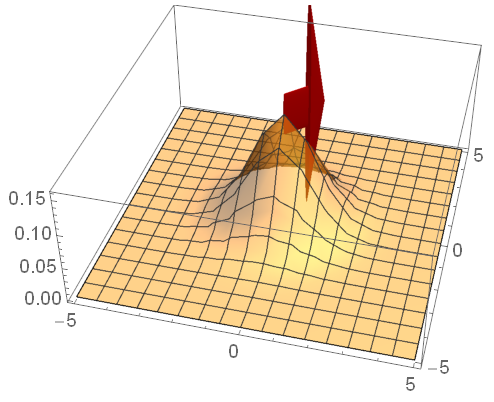
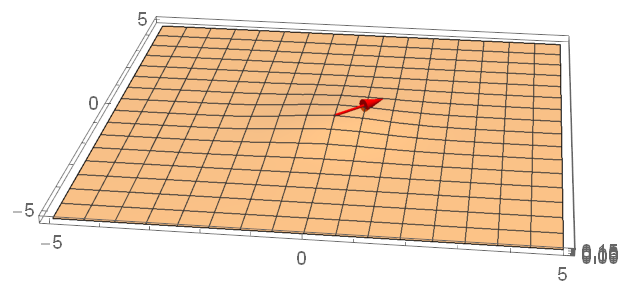
But the problem is that this results in a very squeezed arrow:

Squeezed arrow

I think it has something to do with the different scaling at the z-axis but I don't know how to overcome that (without scaling the original function). Adding the option BoxRatios -> Automatic to the show command makes the arrow look normal but then the plot reduces to a flat surface: Arrow normal but surface is now flat
Related question but without a satisfactory answer for 3D arrows: How to make 3 dimensional arrows look good when their lenghs are wildly different?

So, any ideas of how to place a 3D arrow in a 3D plot without messing one of the graphics up?

$\endgroup$

3 Answers 3

5
$\begingroup$

Expanding a little bit on Michael's nice answer:

 g[x_, y_] := 
   1/(2*\[Pi]*\[Sigma]^2)*E^(-((x^2 + y^2)/(2*\[Sigma]^2))) /. {\[Sigma] -> 1}

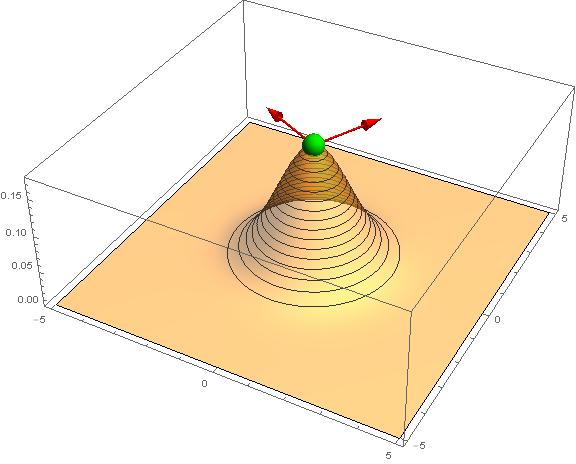
This seems to work in most cases (different ranges, boxratios and graphics primitives):

scale[pl_] :=
 #/Max[#] &[-Subtract @@@ #[[1]]/#[[2]] &[
   Values /@ AbsoluteOptions[pl, {PlotRange, BoxRatios}]]]

With[{z = g[0, 0]},
 Show[
  pl = Plot3D[g[x, y], {x, -5, 5}, {y, -5, 5},
    ImageSize -> Large,
    MeshFunctions -> {#3 &},
    PlotRange -> {Automatic, Automatic, {0, z + 0.02}},
    PlotStyle -> Opacity[0.5],
    PlotPoints -> 60],
  Graphics3D[
   Scale[
    {
     Red, Arrow@Tube[{{0, 0, z}, {1, 2, z}}],
     Rotate[Arrow@Tube[{{0, 0, z}, {1, 2, z}}], 90 Degree, {0, 0, 1}],
     Green, Sphere[{0, 0, z}, 0.3],
     },
    scale@pl]]]] 

enter image description here

$\endgroup$
1
  • $\begingroup$ Very nice; this is exactly the refinement I was envisioning in my answer. I would recommend that the OP choose this as the accepted answer rather than mine. $\endgroup$ Commented Aug 2, 2017 at 14:37
5
$\begingroup$

You can use Scale to "squeeze" the tube back into something resembling the correct shape:

Show[Plot3D[g[x, y], {x, -5, 5}, {y, -5, 5}, PlotRange -> All, PlotStyle -> Opacity[0.5]], 
     Graphics3D[Scale[{Red, Arrow[Tube[{{0, 0, g[0, 0]}, {1, 1, g[0, 0]}}]]}, 
                        0.3*{5, 5, 0.2}, {0, 0, g[0, 0]}]], 
     ImageSize -> Large, PlotRange -> {0, 0.2}]

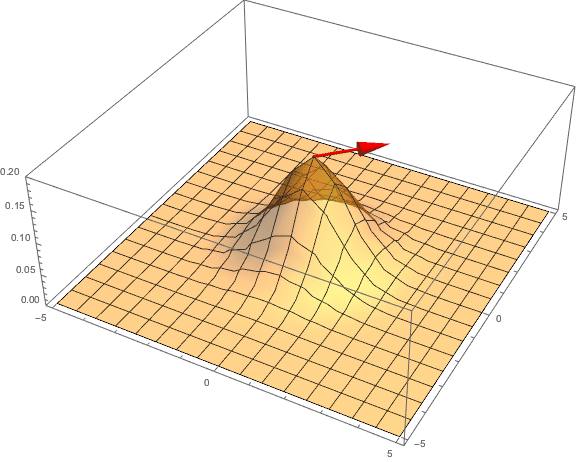
enter image description here

The first list in Scale (0.3*{5, 5, 0.2}) are the rescaling factors in the x, y, and z directions respectively. I simply tweaked these until it "looked right", which is a bit kludgey; this method could be improved by automatically detecting the size of the plot and adjusting these numbers accordingly. The second list in Scale ({0, 0, g[0, 0]}) tells Mathematica to leave this point fixed in the rescaling; you will presumably want to leave the basepoint of the arrow fixed.

$\endgroup$
3
$\begingroup$

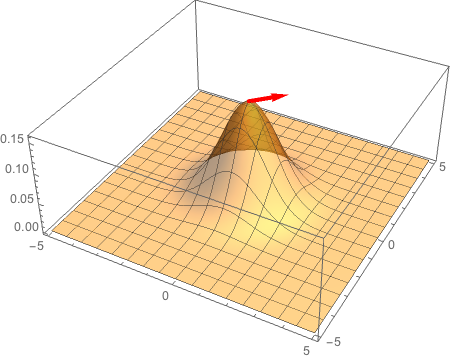
You will have to abandon Tube, which only works well the box ratios are {1, 1, 1}, and fall back on using a thick line.

g[x_, y_] := 1/(2 π σ^2) E^(-((x^2 + y^2)/(2 σ^2))) /. {σ -> 1};

Show[
  Plot3D[g[x, y], {x, -5, 5}, {y, -5, 5},
    PlotRange -> All,
    PlotPoints -> 50,
    PlotStyle -> Opacity[0.5]],
  Graphics3D[
    {Red, Thickness[.01], Arrowheads[.04], 
     Arrow[{{0, 0, g[0, 0]}, {1, 1, g[0, 0]}}]}]]

plot

$\endgroup$

Your Answer

By clicking “Post Your Answer”, you agree to our terms of service and acknowledge you have read our privacy policy.

Not the answer you're looking for? Browse other questions tagged or ask your own question.