3
$\begingroup$

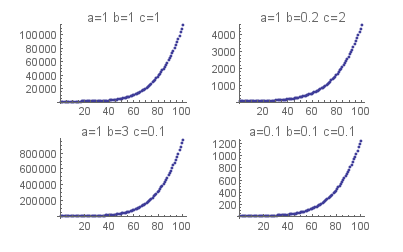
I wrote the code below to do the calculation for each variables. I would like to know how to do this in one loop and to print out timing each time a cycle of calculations is completed. Another question is how to do timing on ParallelTable? If I use //Timing on Table the actual time duration is correct. However on ParallelTable the time duration is not accurate for actual time it took to calculate.(Should I multiply it by number of Kernels used?)

ClearAll;
f1[a_,b_,c_]:=a*x^2+b*x^3+c;
f2[a_,b_,c_]:=a*x+b*x^2+c*(2-x);
x=Range[0,10,0.1];
a1=1;b1=1;c1=1;
f3=f2[a1,b1,c1]+f1[a1,1,c1];
f4=f1[a1,b,c1]*f2[a1,b1,c1];
f5=f3+f4;
plot1=ListPlot[f5,PlotLabel->Style[  " a=" <>ToString[a1]<>" b="<>       ToString[b1]<>" c="<> ToString[c1]]]

a2=1;b2=0.2;c2=2;
f3=f2[a2,b2,c2]+f1[a2,b2,c2];
f4=f1[a2,b2,c2]*f2[a2,b2,c2];
f5=f3+f4;
plot2=ListPlot[f5,PlotLabel->Style[  " a=" <>ToString[a2]<>" b="<>   ToString[b2]<>" c="<> ToString[c2]]]

a3=1;b3=3;c3=0.1;
f3=f2[a3,b3,c3]+f1[a3,b3,c3];
f4=f1[a3,b3,c3]*f2[a3,b3,c3];
f5=f3+f4;
plot3=ListPlot[f5,PlotLabel->Style[  " a=" <>ToString[a3]<>" b="<>    ToString[b3]<>" c="<> ToString[c3]]]

a4=0.1;b4=0.1;c4=0.1;
f3=f2[a4,b4,c4]+f1[a4,b4,c4];
f4=f1[a4,b4,c4]*f2[a4,b4,c4];
f5=f3+f4;
plot4=ListPlot[f5,PlotLabel->Style[  " a=" <>ToString[a4]<>" b="<>     ToString[b4]<>" c="<> ToString[c4]]]

GraphicsGrid[{{plot1,plot2},{plot3,plot4}}]

for loop coding I assign a={1,1,1,0.1} etc.

enter image description here

$\endgroup$
1
  • 1
    $\begingroup$ Use AbsoluteTiming to time parallel operations. $\endgroup$
    – TimRias
    Commented Jul 22, 2017 at 22:19

2 Answers 2

2
$\begingroup$

Yes, it can be done much more easily. Here is one way.

First we get rid of f3 and f4.

f1[a_, b_, c_] := a*x^2 + b*x^3 + c
f2[a_, b_, c_] := a*x + b*x^2 + c*(2 - x)
f5[a_, b_, c_] := f1[a, b, c] + f2[a, b, c] + f1[a, b, c]*f2[a, b, c]

Second we define a function to take the parameters and plot f5. To do the plotting it is not necessary to make a table.

plotF[{a_, b_, c_}, max_: 10] :=
  Plot[f5[a, b, c], {x, 0, max}, 
    PlotLabel -> Row[{"a = ", a, "  b = ", b, "  c = ", c }]]

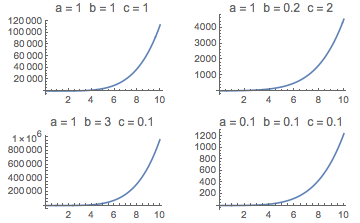
Now we can make the grid.

params = {{1, 1, 1}, {1, .2, 2}, {1, 3, .1}, {.1, .1, .1}};
GraphicsGrid[ArrayReshape[plotF /@ params, {2, 2}]]

grid

Note there is no looping. In Mathematica there is seldom any need to write loops.

$\endgroup$
3
$\begingroup$

This is not an answer but you might get one if you would simplify your coding. For example

f1[{a_, b_, c_}] := a*x^2 + b*x^3 + c
f2[{a_, b_, c_}] := a*x + b*x^2 + c*(2 - x)
f3[a_] := f2[a] + f1[a] + f1[a]*f2[a]

Grid[{
  Table[ListPlot[f3[a], PlotLabel -> "a = " <> ToString[a]],
   {a, {{1, 1, 1}, {1, 0.2, 2}, {1, 3, 0.1}}}]}]

enter image description here

$\endgroup$

Your Answer

By clicking “Post Your Answer”, you agree to our terms of service and acknowledge you have read our privacy policy.

Not the answer you're looking for? Browse other questions tagged or ask your own question.