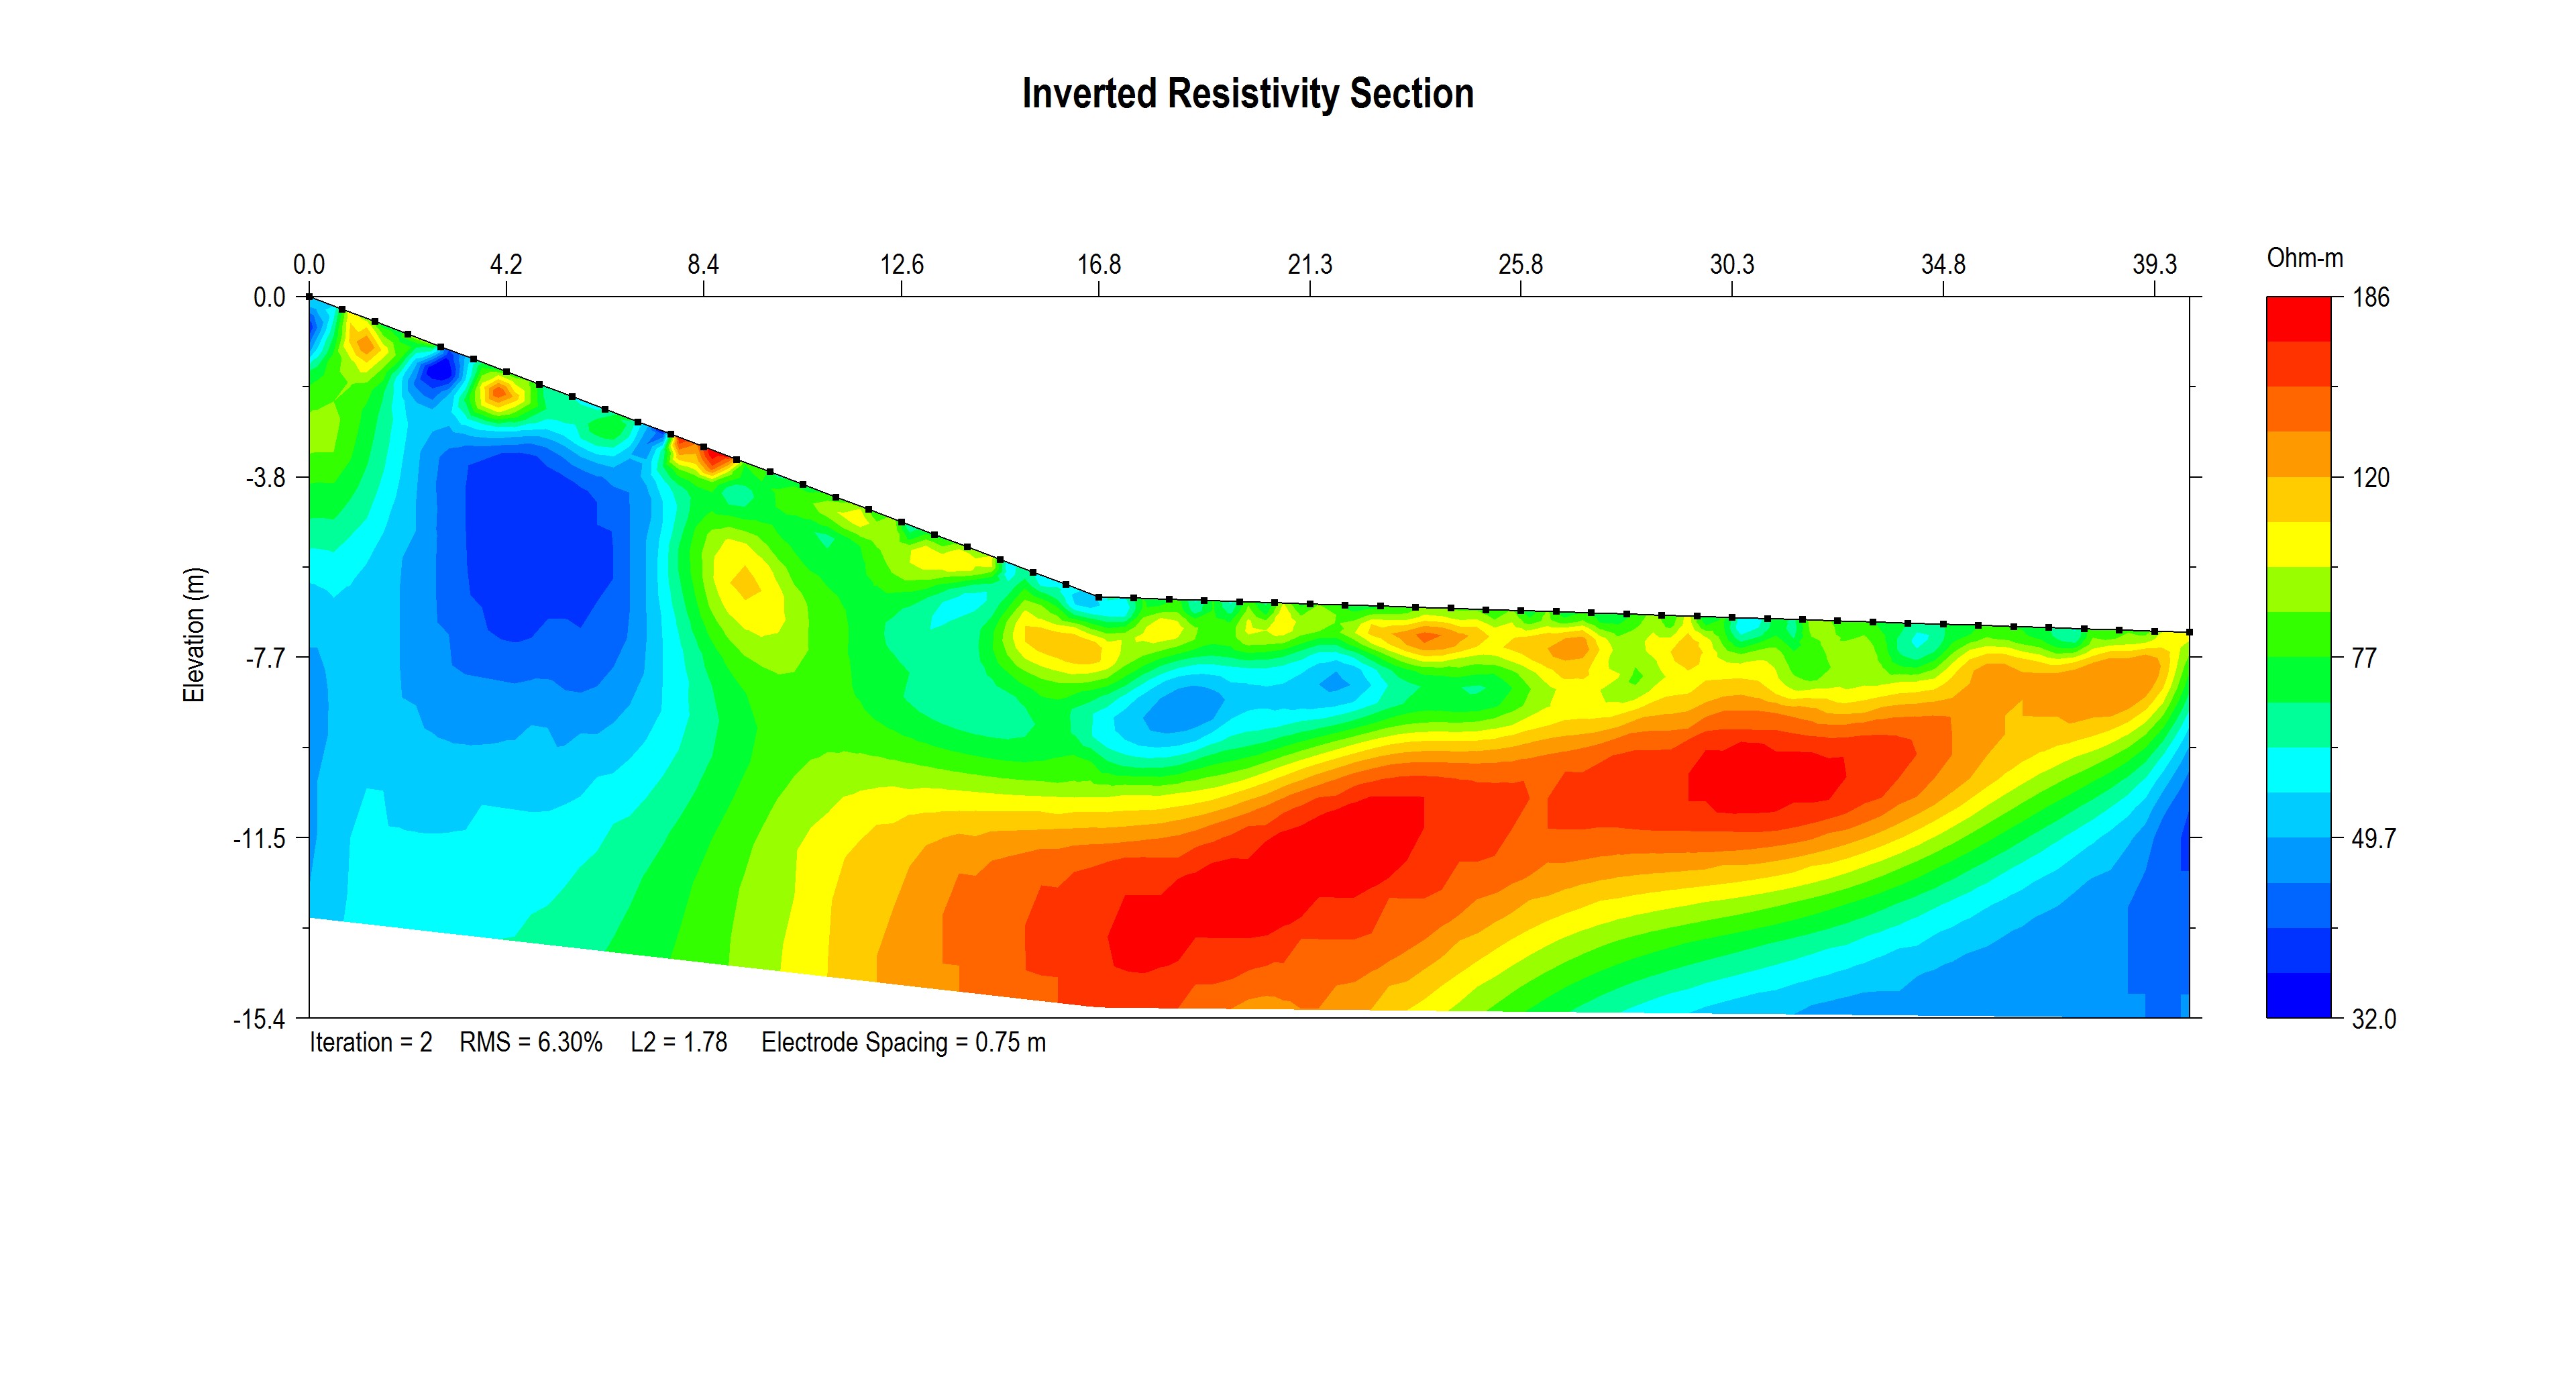
I am using listcontourplot to show my 3D data points but It is interpolating between faraway points and it is changing the outline of the shape.
this is what I want to see:

You can see the sharp cells around the area. and this is my code:
m = Min[data[[All, 3]]]
M = Max[data[[All, 3]]]
lb = 15
ub = 400
nc = 16;
depth = -15;
l2 = {{12, depth}, {12, 0}};
l3 = {{24, depth}, {24, 0}};

ListContourPlot[data,
 PlotRange -> {Automatic, {0, depth}, {m, M}},
 PlotLegends ->
  Placed[BarLegend[{Automatic, {lb, ub}}, LegendMarkerSize -> 500,
    LegendLabel -> Placed["\[CapitalOmega].m", Right],
    LabelStyle -> {Black, 14}, "LabelingFunction" -> (Round[#] &)],
   Bottom],
 ColorFunctionScaling -> False,
 ContourShading -> Hue /@ Reverse[Subdivide[.67, nc - 1]],
 ImageSize -> 1200,
 ContourStyle -> None,
 Contours -> Table[lb*(ub/lb)^(n/nc), {n, 1, nc - 1}],
 PlotRangePadding -> None,
 FrameLabel -> {"Distance (m)", "Depth (m)", None, "Elevation (ft)"},
 LabelStyle -> {Black, 14},
 FrameTicks -> {{All,
    Table[{-3.05 n, 262 - 10 n}, {n, 0, 9, 1}]}, {Table[
     n, {n, 0, 160, 10}], None}},
 AspectRatio -> .3,
 Epilog -> {Black, Dashed, Thick, Line[l2],
   Style[Text["Line 2", {l2[[1, 1]] - 2, depth + 1}], 14], Line[l3],
   Style[Text["Line3", {l3[[1, 1]] - 2, depth + 1}], 14]},
 Mesh -> All
 ]

