1
$\begingroup$

How can I change format of numbers for bar legends. I would like to show numbers without digits after the decimal point.

bar legend

ListContourPlot[data,
 AspectRatio -> Automatic,
 PlotRange -> {Automatic, Automatic, {m, M}},
 PlotLegends -> 
  Placed[BarLegend[{Automatic, {lb, ub}}, LegendMarkerSize -> 200, 
    LegendLabel -> Placed["\[CapitalOmega].m", Bottom], 
    LabelStyle -> {Black, 14}, , LegendFunction -> f], Right],
 ColorFunctionScaling -> False,
 ContourShading -> Hue /@ Reverse[Subdivide[.67, nc - 1]],
 ImageSize -> 1200,
 ContourStyle -> None,
 Contours -> Table[lb*(ub/lb)^(n/nc), {n, 1, nc - 1}],
 PlotRangePadding -> None,
 FrameLabel -> {"Distance (m)", "Depth (m)", None, "Elevation (ft)"},
 LabelStyle -> {Black, 14},
 FrameTicks -> {{All, 
    Table[{-3.05 n, 262 - 10 n}, {n, 0, 9, 1}]}, {All, None}},
 AspectRatio -> .2
 ]
$\endgroup$
4
  • 1
    $\begingroup$ Please show your code. $\endgroup$ Commented Jul 18, 2017 at 16:12
  • $\begingroup$ And what are data? and lb? and ub? and n? and nc? and f? Especially f? $\endgroup$ Commented Jul 18, 2017 at 17:02
  • $\begingroup$ f is what you wrote but did not work. $\endgroup$
    – Mohammad
    Commented Jul 18, 2017 at 17:09
  • $\begingroup$ m = Min[data[[All, 3]]] M = Max[data[[All, 3]]] lb = 15 ub = 300 nc = 16; $\endgroup$
    – Mohammad
    Commented Jul 18, 2017 at 17:09

2 Answers 2

2
$\begingroup$

You can use the undocumented option "LabelingFunction" in your BarLegend:

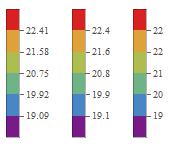
bl1 = BarLegend[{"Rainbow", {18.1234, 23.124}}, 5];
bl2 = BarLegend[{"Rainbow", {18.1234, 23.124}}, 5, 
   "LabelingFunction" -> (Round[#3[[1]], .1] &)];
bl3 = BarLegend[{"Rainbow", {18.1234, 23.124}}, 5, 
   "LabelingFunction" -> (Round[#3[[1]]] &)];
Row[{bl1, bl2, bl3}, Spacer[5]]

enter image description here

$\endgroup$
3
  • $\begingroup$ Thank you. It works. $\endgroup$
    – Mohammad
    Commented Jul 18, 2017 at 20:34
  • $\begingroup$ How does the #3[[1]] part work? I have two plots with log-scaled BarLegend, one from 0.5 to 100, and one from 0.001 to 1000, and I use (NumberForm[#3[[1]], (code..)]&). For the latter, this works, but for the former, I need to replace #3[[1]] with 1.*#3. I am plotting the same type of data, with exactly the same plot functions and options, only the range is different. Where does the difference come from? $\endgroup$
    – a20
    Commented Feb 27, 2020 at 20:39
  • $\begingroup$ @a20, re "how #3[[1]] works", try BarLegend[{"Rainbow", {18.1234, 23.124}}, 5, "LabelingFunction" -> ((Print[InputForm /@ {##}]; Round[#3[[1]]]) &)] to see the form of three arguments labeling function takes. You might want to post the issue in your comment as a new question. $\endgroup$
    – kglr
    Commented Feb 28, 2020 at 16:02
0
$\begingroup$
f[x_] := x /. {NumberForm[y_, {1, 2}] :> Round[y]}

BarLegend[{"Rainbow", N[ {18, 250}]}, LegendFunction -> f]

enter image description here

$\endgroup$
3
  • $\begingroup$ I don't have access to legend tick numbers. $\endgroup$
    – Mohammad
    Commented Jul 18, 2017 at 16:32
  • $\begingroup$ How is that even possible? Where did your legend get the information that the smallest value was $18.089$ and the largest $248.775$? As asked: PLEASE POST YOUR CODE! $\endgroup$ Commented Jul 18, 2017 at 16:35
  • $\begingroup$ David, could you try BarLegend[{"Rainbow", {18.1234, 23.124}}, 5, LegendFunction -> f]? And, in your exampleBarLegend[{"Rainbow", N[ {18, 250}]}] gives the same result with or without the LegendFunction->f. $\endgroup$
    – kglr
    Commented Jul 18, 2017 at 17:41

Your Answer

By clicking “Post Your Answer”, you agree to our terms of service and acknowledge you have read our privacy policy.

Not the answer you're looking for? Browse other questions tagged or ask your own question.