0
$\begingroup$

I have three functions

f1[u_,t_]:=1/32 (7 + 4 Cos[2 t] + Cos[4 t] + 2 Cos[t (-3 + u)] + 
2 Cos[2 t (-1 + u)] + 12 Cos[t] Cos[t u] + 2 Cos[2 t (1 + u)] + 
2 Cos[t (3 + u)]);
f2[u_,t_]:= 1/32 (7 + 4 Cos[2 t] + Cos[4 t] - 2 Cos[t (-3 + u)] + 
2 Cos[2 t (-1 + u)] - 12 Cos[t] Cos[t u] + 2 Cos[2 t (1 + u)] - 
2 Cos[t (3 + u)]);
f3[u_,t_]:=1/32 (5 - Cos[4 t] - 4 Cos[2 t u] + 4 Sin[2 t] - 2 Sin[2 t (1  + u)] - 2 Sin[2 t - 2 t u])

I have used

specificTimes = 
ContourPlot[{f1[u,t] == 0.9999, 
f2[u,t] == 0.00001, f3[u,t] == 0.00001}, {u, 0.0, 
4}, {t, 0, 8 \[Pi]},

ContourStyle -> {Blue, Black, Red}, Frame -> True,

FrameTicks -> {{{0, \[Pi]/2, \[Pi], (3 \[Pi])/2, 2 \[Pi], (5 \[Pi])/
   2, 3 \[Pi], (7 \[Pi])/2, 4 \[Pi], (9 \[Pi])/2, 5 \[Pi], (11 \[Pi])/2,  6 \[Pi], (13 \[Pi])/2, 7 \[Pi], (15 \[Pi])/2, 8 \[Pi]}, {None}}, {{0.5, 1.0, 1.5, 
  2.0, 2.5, 3.0, 3.5, 4.0}, {None}}}]

to obtain the point simultaneously, f1 be as much as possible near to 1.0 and f2 and f3 be as much as possible near to 0.0.

But in the contourplot there are some points which do not show simultaneously the above condition. How can I show the points in the [t, u] surface that satisfy the condition?

$\endgroup$
2
  • $\begingroup$ You have a typo: f3[[u,t]] == 0.00001 should be f3[u,t] == 0.00001. $\endgroup$
    – JimB
    Commented Jun 12, 2017 at 18:31
  • $\begingroup$ I suspect the "missing" points will become more apparent by using ContourStyle -> {Green, Black, Red} and moving farther away from 0 and 1: f1[u,t]==0.95, f2[u,t]==0.001, f3[u,t]==0.001. $\endgroup$
    – JimB
    Commented Jun 12, 2017 at 18:38

3 Answers 3

2
$\begingroup$
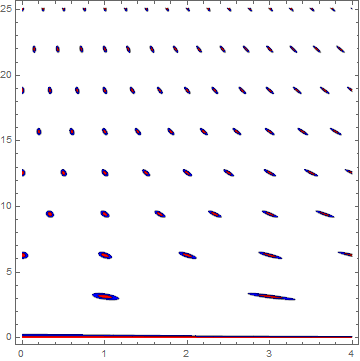
ContourPlot[(f1[u, t] - 1)^2 + f2[u, t]^2 + f3[u, t]^2 , {u, 0, 
  4}, {t, 0, 8 Pi}, Contours -> {0.001, .01}, 
 ColorFunctionScaling -> False, 
 ColorFunction -> (Which[# < .001, Red, # < .01, Blue, True, None] &),
  PlotPoints -> 100]

enter image description here

$\endgroup$
0
$\begingroup$

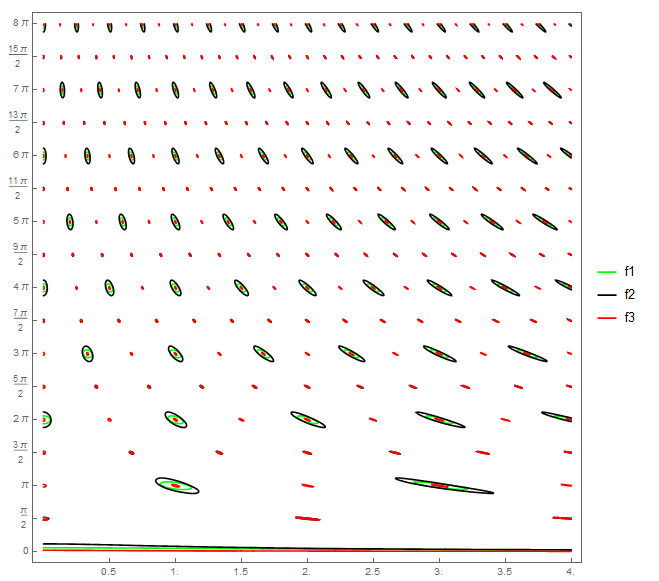
Changing the color scheme slightly, adding in PlotPoints -> 200, and moving a bit away from 0 and 1 might do what you need:

specificTimes = ContourPlot[{f1[u, t] == 0.95, f2[u, t] == 0.001, f3[u, t] == 0.001},
  {u, 0.0, 4}, {t, 0, 8 \[Pi]}, ContourStyle -> {Green, Black, Red},
  ImageSize -> Large, PlotPoints -> 200, Frame -> True,
  FrameTicks -> {{{0, \[Pi]/2, \[Pi], (3 \[Pi])/2, 
      2 \[Pi], (5 \[Pi])/2, 3 \[Pi], (7 \[Pi])/2, 4 \[Pi], (9 \[Pi])/2,
      5 \[Pi], (11 \[Pi])/2, 6 \[Pi], (13 \[Pi])/2, 
      7 \[Pi], (15 \[Pi])/2, 8 \[Pi]}, {None}},
    {{0.5, 1.0, 1.5, 2.0, 2.5, 3.0, 3.5, 4.0}, {None}}},
  PlotLegends -> {"f1", "f2", "f3"}]

Contour plot

$\endgroup$
6
  • $\begingroup$ Thanks a bunch for your answer. But I wish to not have any red points without being overlapped by green and black points. The red points are the places that just one function is 0.001. $\endgroup$ Commented Jun 12, 2017 at 19:23
  • $\begingroup$ On the other hand, 0.95 is large. for this reason the black places are as ellipsoid. $\endgroup$ Commented Jun 12, 2017 at 19:26
  • $\begingroup$ In fact, I do not have any point by itself (lonely points). I wish to find overlapped points. $\endgroup$ Commented Jun 12, 2017 at 19:27
  • $\begingroup$ Not exactly. The "red points" are contours that many times look like points because of their small area. But if you only want to see where all three functions are true (when all are zero or 1), then something else would need to be done. Where all three colors show is approximately where all three equations are satisfied. $\endgroup$
    – JimB
    Commented Jun 12, 2017 at 19:29
  • $\begingroup$ Yes, Please see just a red point. It satisfies for example f2[u, t] == 0.001 but it does not satisfy f1[u, t] ==0.95. The center of each elliptical shapes is the points that I am trying to show them. JUST them and not other unimportant points. $\endgroup$ Commented Jun 12, 2017 at 19:33
0
$\begingroup$

Maybe contour plots isn't what you want but producing the individual contour plots is a good start for knowing your functions. It doesn't appear that too many (if any) of the points in the area of interest have values of u and t that satisfy f1[u,t]==1 and f2[u,t]==0 and f3[u,t]==0.

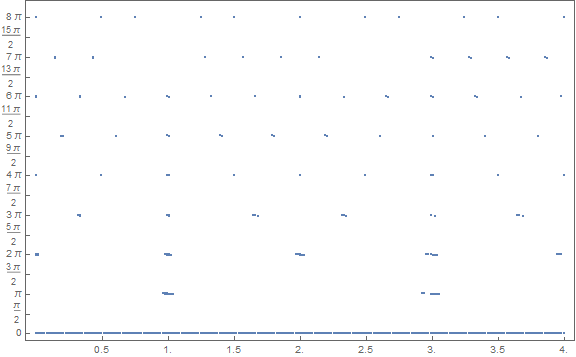
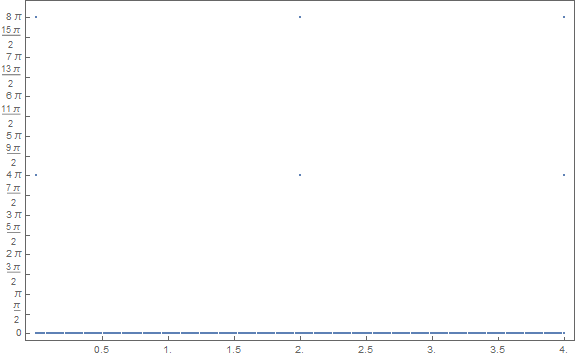
So maybe what you need is to set a threshold of closeness to 1 and 0 and just evaluate the functions on a fine grid of points. Here is one approach with two different thresholds:

α = 0.01
n = 250;
t = Flatten[Table[If[f1[u, t] > 1 - α && f2[u, t] < α && f3[u, t] < α,
     {u, t}, {0, 0}], {u, 0, 4, 4/n}, {t, 0, 8 π, 8 π/n}], 1];
ListPlot[t, Frame -> True, 
 FrameTicks -> {{{0, π/2, π, (3 π)/2, 2 π, (5 π)/2, 3 π,
     (7 π)/2, 4 π, (9 π)/2, 5 π, (11 π)/2, 
     6 π, (13 π)/2, 7 π, (15 π)/2, 8 π}, {None}},
   {{0.5, 1.0, 1.5, 2.0, 2.5, 3.0, 3.5, 4.0}, {None}}}, 
 ImageSize -> Large]

Threshold = 0.01

α = 0.0001
n = 250;
t = Flatten[Table[If[f1[u, t] > 1 - α && f2[u, t] < α && f3[u, t] < α,
     {u, t}, {0, 0}], {u, 0, 4, 4/n}, {t, 0, 8 π, 8 π/n}], 1];
ListPlot[t, Frame -> True,
 FrameTicks -> {{{0, π/2, π, (3 π)/2, 2 π, (5 π)/2, 3 π,
     (7 π)/2, 4 π, (9 π)/2, 5 π, (11 π)/2, 
     6 π, (13 π)/2, 7 π, (15 π)/2, 8 π}, {None}},
   {{0.5, 1.0, 1.5, 2.0, 2.5, 3.0, 3.5, 4.0}, {None}}}, 
 ImageSize -> Large]

Threshold 0.0001

$\endgroup$

Your Answer

By clicking “Post Your Answer”, you agree to our terms of service and acknowledge you have read our privacy policy.

Not the answer you're looking for? Browse other questions tagged or ask your own question.