1
$\begingroup$

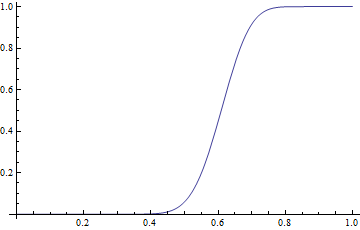
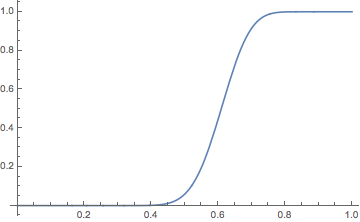
In the setting of the Binomial Distribution, I am trying to figure out how to plot the probability of obtaining $k \ge 31$ for fixed $n$, for success probabilities $p$ between $0$ and $1$.

Why does the code below not work?

DiscretePlot[Table[CDF[BinomialDistribution[50, p], k], {k, {31}}] // Evaluate, {p, 1}, ExtentSize -> Left]
$\endgroup$
0

2 Answers 2

4
$\begingroup$
Plot[SurvivalFunction[BinomialDistribution[50, p], 30], {p, 0, 1}]

Mathematica graphics

Note: As noted by @user120911, this function simplifies to BetaRegularized[p, 1 + m, -m + n]

FullSimplify[SurvivalFunction[BinomialDistribution[n, p], m],
 {m, n} ∈ Integers && n > m >= 0]
 BetaRegularized[p, 1 + m, -m + n]

So

Plot[BetaRegularized[p, 1 + 30, -30 + 50], {p, 0, 1}]

gives the same picture.

$\endgroup$
3
  • $\begingroup$ You need 30, not 31... $\endgroup$
    – ciao
    Commented Jun 6, 2017 at 23:16
  • $\begingroup$ @kglr, it turns out your solution simplifies nicely to the Regularized Beta Function. $\endgroup$
    – user120911
    Commented Jun 19, 2017 at 9:32
  • $\begingroup$ @user120911, good observation. I added your comment to the post. $\endgroup$
    – kglr
    Commented Jun 19, 2017 at 23:31
2
$\begingroup$
Plot[Probability[k >= 31, 
  k \[Distributed] BinomialDistribution[50, p]], 
  {p, 0, 1}]

enter image description here

$\endgroup$

Your Answer

By clicking “Post Your Answer”, you agree to our terms of service and acknowledge you have read our privacy policy.

Not the answer you're looking for? Browse other questions tagged or ask your own question.