You can solve the above system of coupled differential equations using NDSolve Mathematica function numerically.
$$
\begin{align}
\frac{\mathrm dV}{\mathrm dt} &= -\frac{D}{m}-g\sin\theta\\
\frac{\mathrm d\theta}{\mathrm dt} &= \frac{1}{V}\left(\frac{L}{m} -g\cos\theta\right)\\
\frac{\mathrm d\varphi}{\mathrm dt} &= -\frac{V\cos\theta}{r+h}\\
\frac{\mathrm dh}{\mathrm dt} &= V\sin\theta
\end{align}
$$
First one needs to assign correctly the equations, initial values and its variables. The expressions for g and $\rho$ are incorrect and have to be modified. A little care must to be taken in respect to different units used (km,m). The drag force D symbol cannot be used because MMA will recognize this as the derivative function. Here I changed it to Fd. Trigonometric functions entries must be in radians instead degrees and need to be changed with N[angle Degrees]. So we have
s = 12.0687;                       (*surface area of the capsule m^2*)
r = 6371000;                       (*radius of the Earth m *)
g0 = 9.80612;                      (*gravity at surface m/s^2 *)
\[Rho]0 = 1.20654;                 (*density at surface kg/m^3 *)
m = 5500;                          (*mass of capsule kg *)
h0 = 60000;                        (*end of sensible atmosphere m *)
H = 7000;                          (*scaled height m *)

V0 = 7162.8;                       (*velocity of capsule  m/s*)
h0 = 160000;                       (*altitude m *)
\[CurlyPhi]0 = N[10.556 Degree];   (*angular range*)
\[Theta]0 = N[-2.0 Degree];        (*flight path angle*)
\[Alpha] =  N[53 Degree];          (*attack angle*)

g[z_] := g0*(r^2/(r + z)^2);
\[Rho][z_] := \[Rho]0*Exp[-z/H];

cd = 2 (Sin[\[Alpha]])^3;
cl = 2 (Sin[\[Alpha]])^2 Cos[\[Alpha]];

Fd[v_, z_, t_] := (1/2) cd \[Rho][z] v^2 s;
L[v_, z_, t_] := (1/2) cl \[Rho][z] v^2 s;

sol = NDSolve[{
    V'[t] == -(Fd[V[t], h[t], t]/m) - g[h[t]] Sin[\[Theta][t]],
    \[Theta]'[t] == L[V[t], h[t], t]/(m V[t]) - g[h[t]] Cos[\[Theta][t]]/V[t],
    \[CurlyPhi]'[t] == -(V[t] Cos[\[Theta][t]]/(r + h[t])),
    h'[t] == V[t] Sin[\[Theta][t]],
    h[0] == h0,
    V[0] == V0,
    \[Theta][0] == \[Theta]0,
    \[CurlyPhi][0] == \[CurlyPhi]0
    }, {V, \[Theta], \[CurlyPhi], h}, {t, 0, 800}];

pl1 = Plot[Evaluate[V[t] /. sol], {t, 0, 800}, PlotRange -> All,
   FrameLabel -> {StyleForm["t (s)", FontSize -> 13],
     StyleForm["v (km/s)", FontSize -> 13]},
   Frame -> True, PlotStyle -> {Directive[Red, Thick]},
   ImageSize -> 300];
pl2 = Plot[Evaluate[(180*\[Theta][t]/\[Pi]) /. sol], {t, 0, 800},
   PlotRange -> All,
   FrameLabel -> {StyleForm["t (s)", FontSize -> 13],
     StyleForm["\[Theta] (degrees)", FontSize -> 13]},
   Frame -> True, PlotStyle -> {Directive[Green, Thick]},
   ImageSize -> 300];
pl3 = Plot[Evaluate[(180*\[CurlyPhi][t]/\[Pi]) /. sol], {t, 0, 800},
   PlotRange -> All,
   FrameLabel -> {StyleForm["t (s)", FontSize -> 13],
     StyleForm["\[CurlyPhi] (degrees)", FontSize -> 13]},
   Frame -> True, PlotStyle -> {Directive[Orange, Thick]},
   ImageSize -> 300];
pl4 = Plot[Evaluate[(h[t]/1000) /. sol], {t, 0, 800},
   PlotRange -> All,
   FrameLabel -> {StyleForm["t (s)", FontSize -> 13],
     StyleForm["h (km)", FontSize -> 13]},
   Frame -> True, PlotStyle -> {Directive[Blue, Thick]},
   ImageSize -> 300];
GraphicsGrid[{{pl1, pl2}, {pl3, pl4}}]


ApoloPath =
  Table[{\[CurlyPhi][t], ((r + h[t])/1000)}, {t, 0, 800}] /. sol;
pl5 = ListPolarPlot[ApoloPath, PlotStyle -> Red,
   PolarAxes -> Automatic,
   PolarGridLines -> {{0, Pi/2, Pi, 3 Pi/2}, {0.2*r/1000, 0.4*r/1000,
      0.6*r/1000, 0.8*r/1000}},
   PolarTicks -> {"Degrees", Automatic}];
pl6 = Graphics[{Hue[0.6, 0.3, 0.7, .7],
    Disk[{0, 0}, r/1000, {-0.3, 0.3}]}];
Show[pl5, pl6,
 PlotRange -> {{0, r/1000}, {-7000 Sin[0.3], 7000 Sin[0.3]}}]
ApoloPathTime =


Table[{r (\[CurlyPhi][t] + 0.15336)/
       1852., (h[t]/(1000*0.3048))}, {t, 0, 800}] /. sol;

TimeTicks =
  Table[{r (\[CurlyPhi][t] + 0.15336)/
       1852., (h[t]/(1000*0.3048))}, {t, 0, 800, 30}] /. sol;

pl7 = ListLinePlot[ApoloPathTime,
   ScalingFunctions -> {"Reverse", Identity}, PlotRange -> All,
   FrameLabel -> {StyleForm["Range (Nautical Miles)", FontSize -> 13],
      StyleForm["h (1000 ft)", FontSize -> 13]}, Frame -> True,
   PlotStyle -> {Directive[Black, Thick]}, ImageSize -> 300];

pl8 = ListPlot[TimeTicks, ScalingFunctions -> {"Reverse", Identity},
   PlotMarkers -> {"|"}, PlotRange -> All,
   FrameLabel -> {StyleForm["Range (Nautical Miles)", FontSize -> 13],
      StyleForm["h (1000 ft)", FontSize -> 13]}, Frame -> True,
   PlotStyle -> {Directive[Red, Thick]}, ImageSize -> 300];

Show[pl7, pl8]
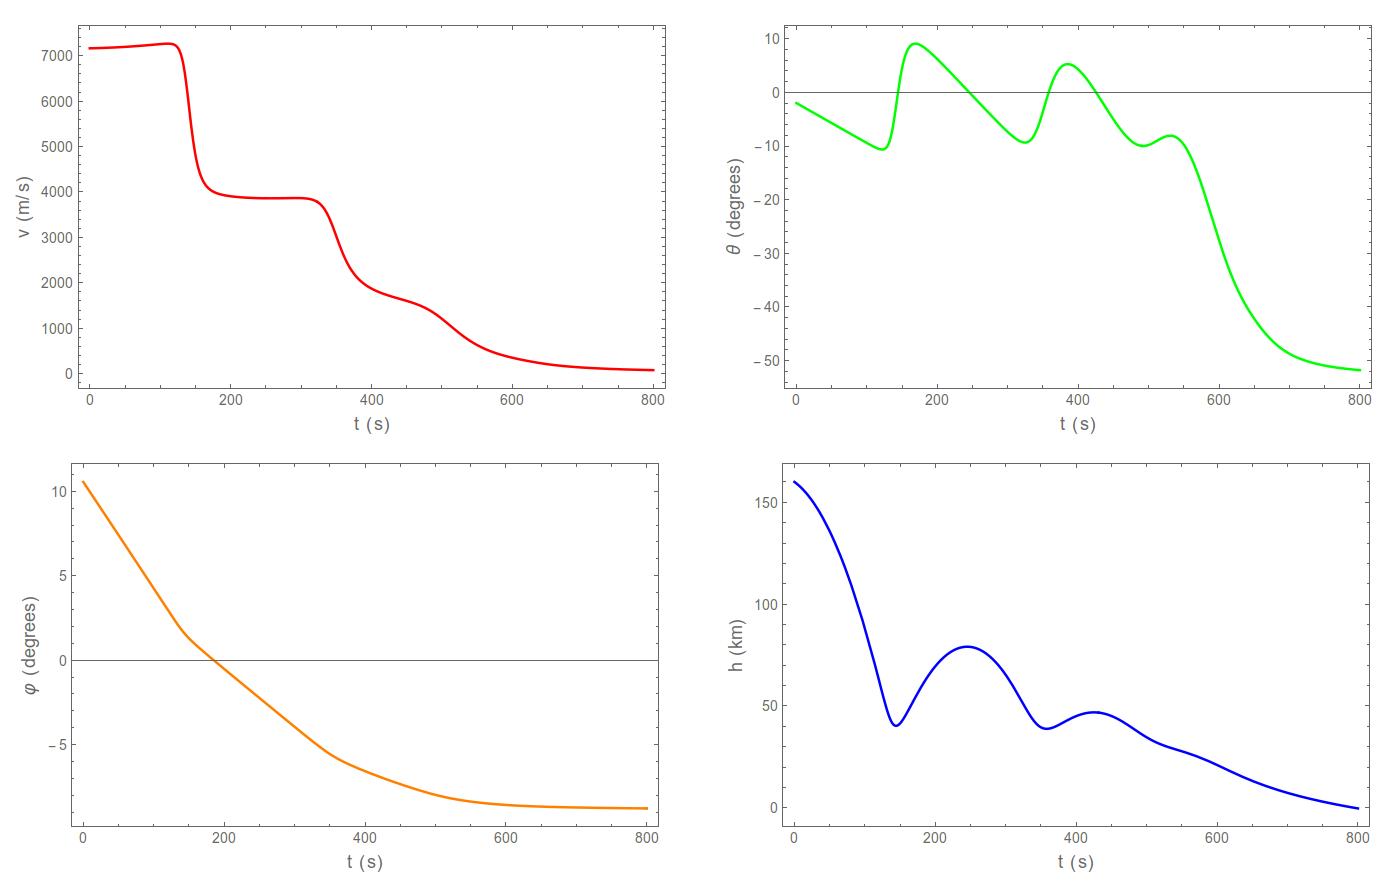
In this manner the output functions will be

The above behavior shows us that the landing must occur in a time around 800 seconds.
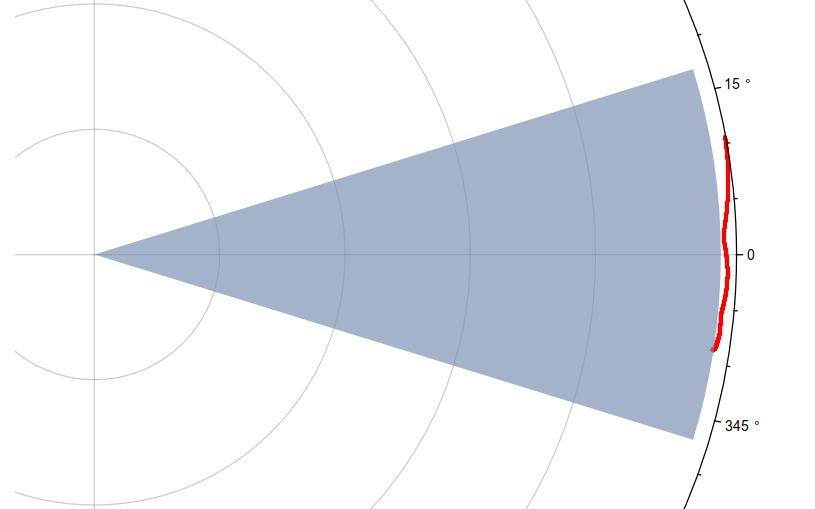
Also, one can plot the the trajectory of the Apollo spacecraft parametrically ($\varphi(t)$,$r+h(t)$) in polar coordinates adjusting correctly the units to meters and degrees.


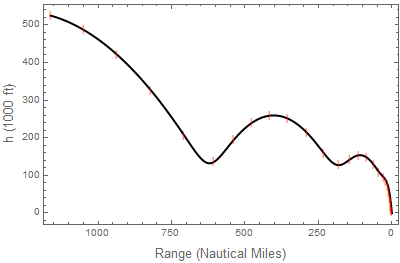
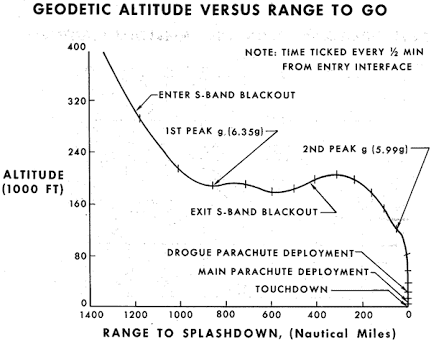
These results can be compared with the next plot


