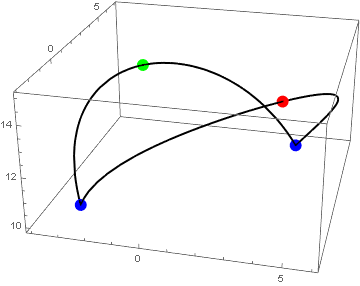
Here are the outputs from Minimize
minM = Minimize[
   {
    Sqrt[(x + 3)^2 + (y + 1)^2] + Sqrt[(x - 4)^2 + (y - 6)^2],
    (x - 1)^2 + (y - 2)^2 == 25
    },
   {x, y}
   ] // Simplify
(* {2 Sqrt[50 - 5 Sqrt[2]], {x -> 1 - 5/Sqrt[2],
  y -> 2 + 5/Sqrt[2]}} *)
Maximize
maxM = Maximize[
   {
    Sqrt[(x + 3)^2 + (y + 1)^2] + Sqrt[(x - 4)^2 + (y - 6)^2],
    (x - 1)^2 + (y - 2)^2 == 25
    },
   {x, y}
   ] // Simplify
(* {2 Sqrt[5 (10 + Sqrt[2])], {x -> 1 + 5/Sqrt[2],
  y -> 2 - 5/Sqrt[2]}} *)
and FunctionRange
funR = FunctionRange[
   {
    Sqrt[(x + 3)^2 + (y + 1)^2] + Sqrt[(x - 4)^2 + (y - 6)^2],
    (x - 1)^2 + (y - 2)^2 == 25
    },
   {x, y},
   z
   ] // Simplify
(* 7 Sqrt[2] <= z <= 2 Sqrt[5 (10 + Sqrt[2])] *)
in Mathematica version 11.1.
For the FunctionRange case we use Solve to determine the corresponding x and y coordinates.
{minR, maxR} = {funR[[1]], funR[[5]]}

solMinR = Solve[{
   Sqrt[(x + 3)^2 + (y + 1)^2] + Sqrt[(x - 4)^2 + (y - 6)^2] == minR,
   (x - 1)^2 + (y - 2)^2 == 25
   },
  {x, y}
  ]
(* {{x -> -3, y -> -1}, {x -> 4, y -> 6}} *)

solMaxR = Solve[{
    Sqrt[(x + 3)^2 + (y + 1)^2] + Sqrt[(x - 4)^2 + (y - 6)^2] == maxR,
    (x - 1)^2 + (y - 2)^2 == 25
    },
   {x, y}
   ][[1]]
(* {x -> 1/2 (2 + 5 Sqrt[2]), y -> 1/2 (4 - 5 Sqrt[2])} *)
We will use ParametricPlot3D to plot the curve in 3D space that corresponds to the function with the x and y coordinates constrained and Graphics3D to plot the points from Minimize, Maximize and FunctionRange.
It is apparent by visual inspection of the constraint
(x - 1)^2 + (y - 2)^2 == 25
that this is a circle of radius 5 centered at {x,y} == {1,2}.
This can be parameterized as
x = 5 Cos[θ] + 1
y = 5 Sin[θ] + 2
with θ ranging from zero to 2 π.
The function is re-written in terms of θ
Sqrt[(x + 3)^2 + (y + 1)^2] +
   Sqrt[(x - 4)^2 + (y - 6)^2] /. {x -> 5 Cos[θ] + 1,
   y -> 5 Sin[θ] + 2} // Simplify
(* Sqrt[10] (Sqrt[5 - 3 Cos[θ] - 4 Sin[θ]] + Sqrt[
   5 + 4 Cos[θ] + 3 Sin[θ]]) *)
Putting this all together in the graphics below the green point is from Minimize, the red point from Maximize and the blue points from FunctionRange.
It is apparent that Minimize gives a false answer and FunctionRange gives the correct minimum.
Show[
 ParametricPlot3D[
  {5 Cos[θ] + 1, 5 Sin[θ] + 2,
   Sqrt[10] (Sqrt[5 - 3 Cos[θ] - 4 Sin[θ]] + Sqrt[
      5 + 4 Cos[θ] + 3 Sin[θ]])},
  {θ, 0, 2 π},
  PlotStyle -> Black
  ],
 Graphics3D[
  {
   PointSize[0.035],
   Green,
   Point[{1 - 5/Sqrt[2], 2 + 5/Sqrt[2], 2 Sqrt[50 - 5 Sqrt[2]]}],
   Blue,
   Point[{-3, -1, 7 Sqrt[2]}],
   Point[{4, 6, 7 Sqrt[2]}],
   Red,
   Point[{1 + 5/Sqrt[2], 2 - 5/Sqrt[2], 2 Sqrt[5 (10 + Sqrt[2])]}]
   }
  ],
 ViewPoint -> {0.75, -3, 1.4}
 ]


Minimizeis incorrect, you can checkNMinimizereturns the same result asFunctionRange. The resultMinimizegives is actually a local maximum on the circle defined by the constraint. I'd call this a bug. $\endgroup$Minimizein version 9 returns the correct answer. In version 10.4 and version 11.1 I get the wrong answer. $\endgroup$