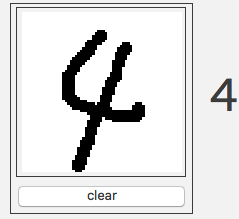
The last example in the Classify can be used as a start. lowriniak has translated the code from the cell in the example in the answer here. The example uses logistic regression but the classifier can be changed to a neural network easily:
lenet = NetModel["LeNet Trained on MNIST Data"];

(*Inputs for the canvas and brush size*)

With[
{xsize = 64, ysize = 64, thickness = 3},

(*Makes the dynamic environment for variables to update and track each other*)

DynamicModule[
  {
    (*Set up the initial graphics objects (so different drawing canvases basically*)

    imgdata = ImageData[Image[Table[1, {ysize}, {xsize}]]],
    p1 = {53, 23},
    p2 = {53, 23},
    blank = ImageData[Image[Table[1, {ysize}, {xsize}]]]
  },
  (*Deploy makes it harder to accidentally delete your interface*)
  Deploy[
    (*Grid formats the elements*)
    Row[{
    Grid[{
      {
        (*EventHandler will watch what your mouse does, you can customise the gestures here*)
        EventHandler[
          (*This is the thing that the event handler watches*)
          Dynamic[
            (*This checks the image is valid then constructs it*)
            If[
              MatrixQ[imgdata],
              Framed[Image[imgdata, ImageSize -> {160, 160}]],
              None
            ],
            (*This means only one symbol is watched for updates, not all of them*)
            TrackedSymbols :> {imgdata}
          ],
          {
             (*This defines what click and drag does*)
            "MouseDown" :> (
              p1 = (p2 = PixelPos[]);
              (*A click paints a dot*)
              PaintDot[imgdata, p1];
              Null
            ),
            (*A drag paints a line*)
            "MouseDragged" :> (p1 = p2; p2 = PixelPos[];
            PaintLine[imgdata, p1, p2]; Null)
          }
        ]
      },
      (*Buttons for clearing the canvas and outputting the data.  You can make your own actions here*)
      {Button["clear", imgdata = blank]}
    },
    Frame -> True
    ]
  ,"  ",
  Style[Dynamic[lenet[Image[imgdata]]],50]}]],
  (*Here is where all the painting tools are defined*)
  Initialization :> {
    (*This finds the mouse position in the graphics and rounds it to the nearest pixel (I think)*)
    PixelPos[] := Replace[
      MousePosition["Graphics"],
      {{  i_, j_} :>Round[{ysize - j, i}], _ :>   None}
    ],
    (*This takes a position {i1, j1} and makes a disk of the data around that point of radius 2.5 into 0 values (i.e. black)*)
    Attributes[PaintDot] = {HoldFirst},
    PaintDot[data_Symbol,  p : {i1_, j1_}] := Block[
      {dimx = Length[First[data]], dimy = Length[data]},
      Do[
        If[
          EuclideanDistance[N[{i, j}],  N[p]] < (thickness*(3/4)),
          Part[data, i, j] = 0.
        ],
        {i,  Max[i1 - thickness, 1], Min[i1 + thickness, dimx]},
        {j,  Max[j1 - thickness, 1],  Min[j1 + thickness, dimy]}
      ]
    ],
    (*This takes a start and end point, interpolates between them, and makes a line of thickness defined in the With statement as with PaintDot*)
    Attributes[PaintLine] = {HoldFirst},
    PaintLine[data_, {i1_,   j1_}, {i2_, j2_}] := Block[
      {dimx = Length[First[data]], dimy = Length[data], indices, ib, ie, jb, je},
      indices = interpolatePoints[N[{i1, j1}], N[{i2, j2}], (thickness*(3/4))];
      {ib, ie} =  Sort[{i1, i2}];
      {jb, je} =  Sort[{j1, j2}];
      {{ib, jb}, {ie, je}} =
      Transpose[
        {Clip[#1, {1, dimy}], Clip[#2, {1, dimx}]} & @@ Transpose[{{ib, jb} - thickness, {ie, je} + thickness}]
      ];
      Quiet[Do[
        If[
          Min[Map[EuclideanDistance[N[{i, j}], #] & , indices]] < (thickness*(3/4)),
          Part[data, i, j] =  0.
        ],
        {i, ib, ie},
        {j, jb, je}
      ]];
      Null
    ],

  (*This checks how far apart two points are and if they are further than 3 pixels apart, breaks up the line into segments of length 3*)
  interpolatePoints[start_, stop_] := Module[
    {dist, unit},
    dist = N[ EuclideanDistance[start, stop]];
    If[
      dist < thickness,
      Return[{start, stop}]];
      unit = Normalize[stop - N[start]];
      Append[stop][Table[start + i unit, {i, 0, dist, thickness}]]
    ],
    (*This I think does the same as before but with a generalised step size*)
    interpolatePoints[p1_, p2_, r_] :=  Module[{d, v},
      d = EuclideanDistance[p1, p2];
      If[d < 2 r, Return[{p1, p2}]];
      v = Normalize[p2 - p1];
      Developer`ToPackedArray[
        Append[p2][Table[p1 + i v, {i,  0., d, r}]],
        Real
      ]
    ]
  }
]]

It runs smoothly on my 4-year-old macbook pro.


URLFetch::invhttp: Transferred a partial file.and can't run the example? $\endgroup$