1
$\begingroup$

consider the following function

α = 1/Sqrt[(1 - η^2)^2 + 4 D0^2 η^2];
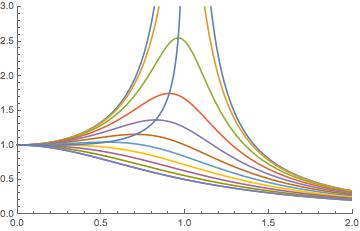
p1 = Plot[{Evaluate[Table[α, {D0, 0, 1, .1}]], 1/(1 + η^2)}, {η, 0, 2}, 
       PlotRange -> {{0, 2}, {0, 3}}]

enter image description here

i now wanted to calculate the function that goes through all the maxima of this function for $\eta \in(0,1)$.

Using

MaxValue[α, D0]

gives

enter image description here

while

Maximize[α, D0]

yields

enter image description here

which are both not what I'm looking for. Using the straight forward approach

max = α /. Solve[D[α, η] == 0]

enter image description here

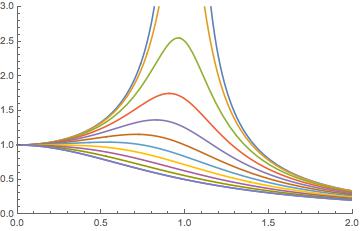
p2 = Plot[max[[1]], {η, 0, 1}, PlotRange -> {{0, 2}, {0, 3}}]
Show[p1, p2]

enter image description here

it works. I guess i didn't quite get how MaxValue works. Can someone teach me, what I did wrong?

$\endgroup$
4
  • $\begingroup$ You can also get all the maxima with Maximize[\[Alpha], D0]. And from the docs of MaxValue under Details and Options: "MaxValue[\[Ellipsis]] is effectively equivalent to First[Maximize[\[Ellipsis]]]." That explains it. $\endgroup$ Commented Feb 17, 2017 at 8:32
  • $\begingroup$ I used that too but the correct solution is not under the given results $\endgroup$
    – freddy90
    Commented Feb 17, 2017 at 8:38
  • $\begingroup$ The behavior you show suggests that D0 has been given a value somewhere at top-level in notebook. If so, that is source of your trouble. $\endgroup$
    – m_goldberg
    Commented Feb 17, 2017 at 9:04
  • $\begingroup$ I checked and D0 hasn't been given any value. $\endgroup$
    – freddy90
    Commented Feb 17, 2017 at 9:14

1 Answer 1

1
$\begingroup$

Forgive me if this is entirely not what you were asking but your final line:

I guess i didn't quite get how MaxValue works. Can someone teach me, what I did wrong?
suggests that perhaps an example of MaxValue doing something, anything, useful might help.

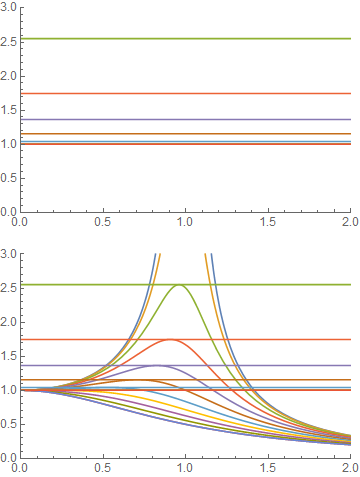
mv = MaxValue[α, η];

p3 = Plot[Evaluate[Table[mv, {D0, 0, 1, .1}]], {η, 0, 2}, 
  PlotRange -> {{0, 2}, {0, 3}}]

Show[p1, p3]

enter image description here

So MaxValue quite handily gives is the maximum value that is reached for each value of D0.

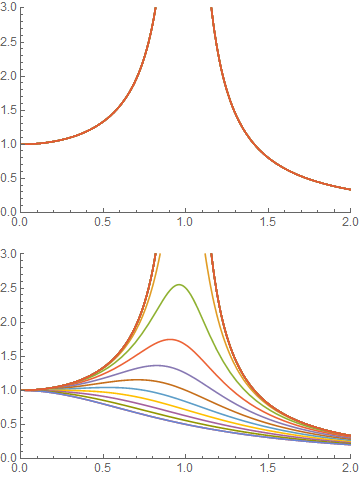
Likewise MaxValue[α, D0] gives us the maximum value that is reached for each value of η, which is the uppermost line in the plot:

mv2 = MaxValue[α, D0]

p4 = Plot[Evaluate[Table[mv2, {D0, 0, 1, .1}]], {η, 0, 2}, 
  PlotRange -> {{0, 2}, {0, 3}}]

Show[p1, p4]

enter image description here

$\endgroup$
1
  • $\begingroup$ Thank you. I guess my attempt to do this using MaxValue was doomed to fail $\endgroup$
    – freddy90
    Commented Feb 17, 2017 at 12:26

Your Answer

By clicking “Post Your Answer”, you agree to our terms of service and acknowledge you have read our privacy policy.

Not the answer you're looking for? Browse other questions tagged or ask your own question.