1
$\begingroup$

I am using the code from this answer, to optimize a portfolio of stocks. This is the code:

Portfolio = {"AAPL", "BA", "IBM", "BMW.DE", "DIS", "R", "PEP", 
   "BRBY.L", "AXP", "BTI"};
data = FinancialData[#, "Price", {{2004}, {2012}, "Month"}][[All, 
      2]] & /@ Portfolio;
Returns = Differences[Log[data[[#]]]] & /@ Range[10];
n = 10;
WeightsVector = Subscript[w, #] & /@ Range[n]
VarianceVector = Subsuperscript[\[Sigma], #, 2] & /@ Range[n]
SDVector = Subscript[\[Sigma], #] & /@ Range[n]
CovMatrix = 
  Array[\[Sigma], {n, n}] /. {\[Sigma][i_, j_] :> 
     Subscript[\[Sigma], ToString@j <> ToString@i] /; i > j, \[Sigma][
      i_, j_] :> 
     Subscript[\[Sigma], ToString@i <> ToString@j] /; i < j, \[Sigma][
      i_, j_] :> Subsuperscript[\[Sigma], i, 2] /; i == j};
PortfolioVariance := WeightsVector.CovMatrix.WeightsVector;
PortfolioMean := WeightsVector.MeanVector;
MeanVector = Mean@Transpose@Returns*12;
VarianceVector = Variance@Transpose@Returns*12;
SDVector = StandardDeviation@Transpose@Returns*Sqrt@12;
CovMatrix = Covariance@Transpose@Returns;
PortfolioVariance := WeightsVector.CovMatrix.WeightsVector;
MV = FindMinimum[{PortfolioVariance, Total[WeightsVector] == 1}, 
  WeightsVector]
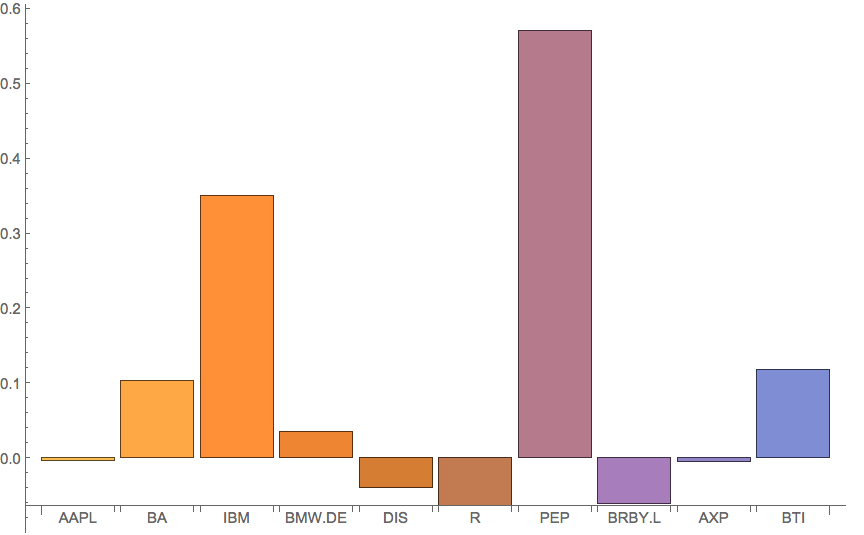
BarChart[{Last[MV[[2, #]]] & /@ Range[n]}, ImageSize -> Large, 
 ChartLabels -> Portfolio]

This works perfectly, however, when I change the years in the data variable from 2004 and 2012 to 2004 and 2016, it errors, saying that the first two levels could not be transposed. I'm not exactly sure why this is happening, I've examined all the variables and they stay the same except of course the numbers change.

How can I fix this, and why is it happening?

$\endgroup$

1 Answer 1

3
$\begingroup$
Portfolio = {"AAPL", "BA", "IBM", "BMW.DE", "DIS", "R", "PEP", "BRBY.L", 
   "AXP", "BTI"};

n = Length[Portfolio];

Extending the date range to 2016

data = FinancialData[#, "Price", {{2004}, {2016}, "Month"}][[All, 2]] & /@ 
   Portfolio;

Length /@ data

(*  {144, 144, 144, 145, 144, 144, 144, 144, 144, 144}  *)

Note that not all of the Portfolio data lists are the same Length so the matrix is "ragged", this precludes a Transpose. Truncate the longer Portfolio data lists so that all are the same Length.

data = #[[1 ;; Min[Length /@ data]]] & /@ data;

Returns = Differences[Log[data[[#]]]] & /@ Range[n];

WeightsVector = Subscript[w, #] & /@ Range[n];

VarianceVector = Subsuperscript[σ, #, 2] & /@ Range[n];

SDVector = Subscript[σ, #] & /@ Range[n];

CovMatrix = Array[σ, {n, n}] /. {
    σ[i_, j_] :> Subscript[σ, ToString@j <> ToString@i] /; i > j,
    σ[i_, j_] :> Subscript[σ, ToString@i <> ToString@j] /; i < j,
    σ[i_, j_] :> Subsuperscript[σ, i, 2] /; i == j};

PortfolioVariance := WeightsVector.CovMatrix.WeightsVector;

PortfolioMean := WeightsVector.MeanVector;

MeanVector = Mean@Transpose@Returns*12;

VarianceVector = Variance@Transpose@Returns*12;

SDVector = StandardDeviation@Transpose@Returns*Sqrt@12;

CovMatrix = Covariance@Transpose@Returns;

PortfolioVariance := WeightsVector.CovMatrix.WeightsVector;

MV = FindMinimum[{PortfolioVariance, Total[WeightsVector] == 1}, 
   WeightsVector];

BarChart[{Last[MV[[2, #]]] & /@ Range[n]}, ImageSize -> Large, 
 ChartLabels -> Portfolio]

enter image description here

$\endgroup$

Your Answer

By clicking “Post Your Answer”, you agree to our terms of service and acknowledge you have read our privacy policy.

Not the answer you're looking for? Browse other questions tagged or ask your own question.