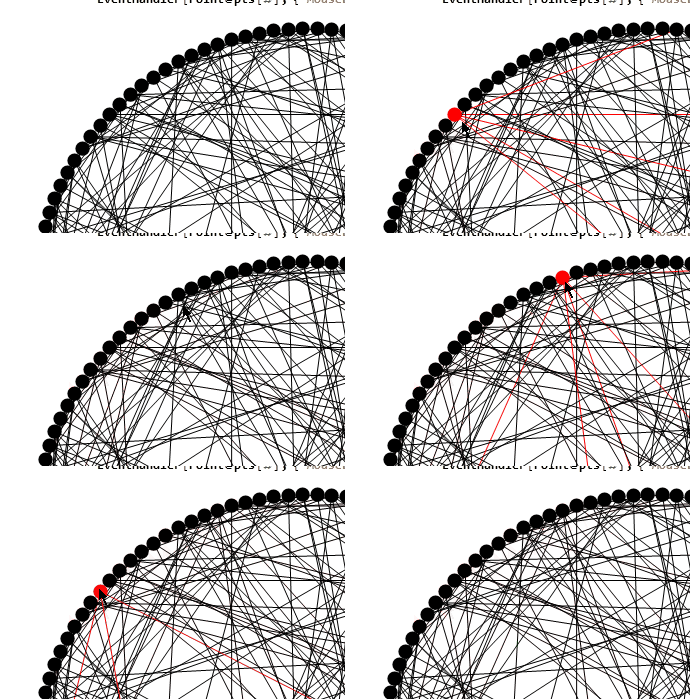
I was looking at how to reproduce the interactivity in this visualization (the layout can be done like this). Hovering a node with the mouse highlights all edges that are connected to it. How can we reproduce this type of interactivity in Mathematica and still preserve good performance?
If there is a single notebook element which needs to react to interaction, there are usually direct ways to do that, without the need for intermediate variables. For example:
Graphics[{Dynamic@Style[Disk[], If[CurrentValue["MouseOver"], Red, Black]]}]
But in the example linked above, edges must highlight in response to hovering vertices and there's a many-to-many relationship between these two types of objects. Each edge must respond to hovering two different vertices. Hovering a vertex must highlight multiple different edges. How can we access the state of one type of object (vertex) while computing the dynamic style of an edge?
I tried two approaches:
The first one uses a boolean vector in a
DynamicModuleto store the hover state of vertices. This is then read by the styling of edges. This approach is not fast enough.The second one uses
MouseAnnotation. This is considerably slower than the first one.
Can we make it faster?
Let's make a graph:
n = 80; (* number of vertices *)
names = Range[n]; (* vertex names, in this case they are simply the vertex indices *)
pts = AssociationThread[names -> N@CirclePoints[n]]; (* vertex coordinates *)
edges = RandomSample[Subsets[names, {2}], 250]; (* graph edges *)
With boolean vector in DynamicModule:
DynamicModule[{state = ConstantArray[False, n]},
   Deploy@Graphics[
    {
      With[{pt1 = pts[#1], pt2 = pts[#2]},
        {Dynamic@If[state[[#1]] || state[[#2]], Red, Black], Line[{pt1, pt2}]}
      ]& @@@ edges,

      PointSize[0.025],
      With[{pt = pts[#]},
        {Dynamic@If[state[[#]], Red, Black],
         EventHandler[Point[pt],
           {"MouseEntered" :> (state[[#]] = True),
            "MouseExited"  :> (state[[#]] = False)}
         ]
        }
      ]& /@ names
    },
   ImageSize -> Large]]
With MouseAnnotation. Warning: this may temporarily freeze the front end!
Deploy@Graphics[
  {
   With[{pt1 = pts[#1], pt2 = pts[#2]},
    {Dynamic@If[MouseAnnotation[] === #1 || MouseAnnotation[] === #2, Red, Black],
     Line[{pt1, pt2}]}
   ]& @@@ edges,

   PointSize[0.025],
   With[{pt = pts[#]},
     Annotation[
       Dynamic@Style[Point[pt], If[CurrentValue["MouseOver"], Red, Black]],
       #,
       "Mouse"
     ]
   ]& /@ names
  },
  ImageSize -> Large
]
The graph size in this example is not excessive. It is about the same as the vertex and edge counts of ExampleData[{"NetworkGraph", "LesMiserables"}] (77, 254), which I used while working on the layout part.


Deploywhen events handling matters: Passing mouse related events broken by Deploy $\endgroup$