1
$\begingroup$

I have a list of figures and strings to plot in a movie where each frame is slightly different from the previous one. I achieved that with the following code, where the g[i] are graphical elements (Points and Lines), and the S[i] are strings (timestamps). I used Animate because it authomatically resets a frame's position in case the user would rotate it.

    Animate[Labeled[
  Graphics3D[g[[i]], 
   ViewPoint -> Front, 
   ImageSize -> Full], s[[i]], Top], {i, 1, 81, 1},  
 AnimationRunning -> False, DefaultDuration -> 20, 
 PreserveImageOptions -> False]

Now, I wish to make the plot rotate back and forth as the movie goes on. I used the following code:

Animate[Labeled[
  Graphics3D[g[[i]], 
   ViewPoint -> {Sin[t], -2.4 + Sin[t]/2, 2*Sin[t]}, 
   ImageSize -> Full], s[[i]], Top], {i, 1, 81, 1}, {t, 0, Pi}, 
 AnimationRunning -> False, DefaultDuration -> 20, 
 PreserveImageOptions -> False]

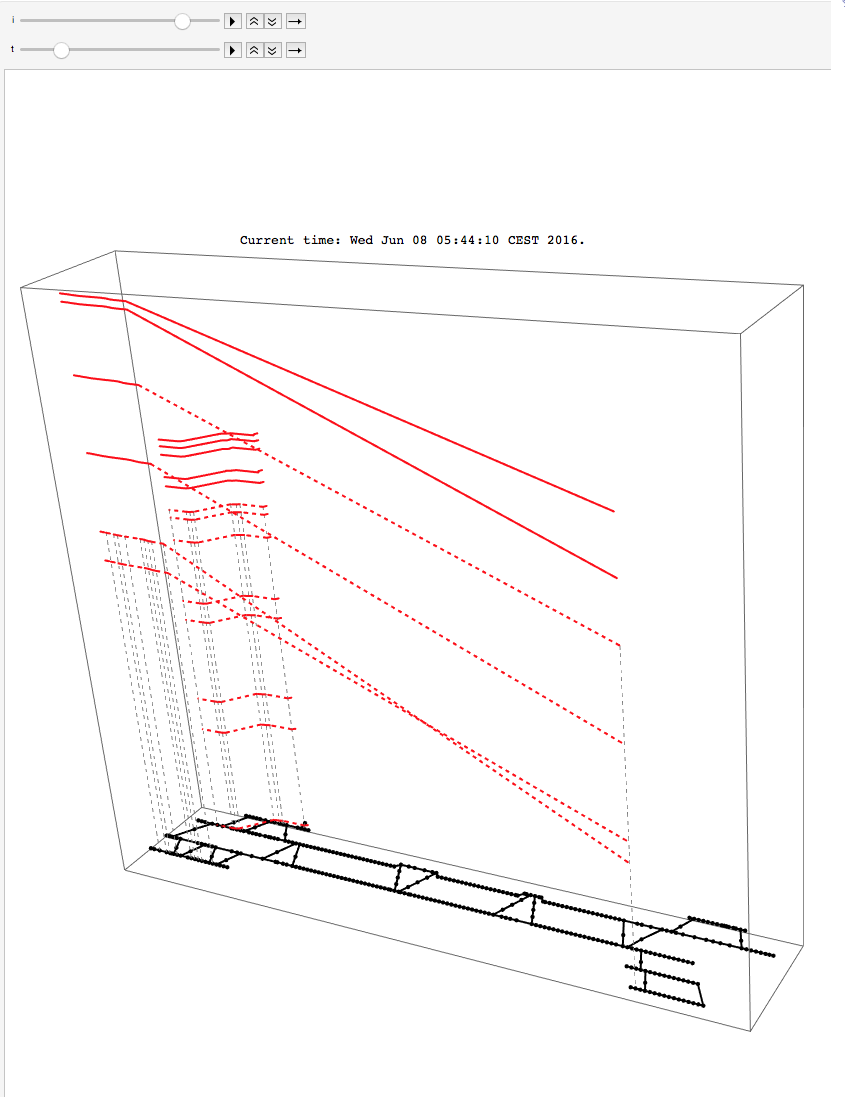
And the plot looks like this: Frame of the plot

Finally, to my question: how do I set up different durations for the two animations (view point and frame)? Currently, they both take 20 seconds, but I wish the viewpoint rotation would be faster, as well as to be running by default; however, my attempts to set AnimationRunning as False for one variable and True for the other did not succeed.

$\endgroup$
2
  • $\begingroup$ I'm not sure whether you can have only one animation running at the start, but for the viewpoint animation, shouldn't you be able to control that animation's "speed" by varying the frequency in the Sin argument? I.e. using Sin[2 t] instead of Sin[t] should have the ViewPoint oscillate twice as fast, etc. $\endgroup$
    – MarcoB
    Commented Jul 5, 2016 at 17:00
  • $\begingroup$ Smart remark! Thank you a lot. I still hope it is possible to have different rates though, via some Mathematica instruction $\endgroup$
    – TedBee
    Commented Jul 6, 2016 at 7:09

1 Answer 1

1
$\begingroup$

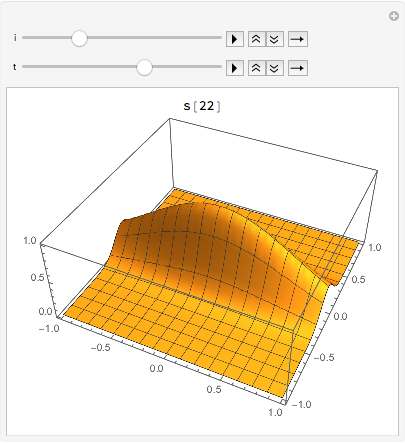
Animator basically constructs and Manipulate. Manipulate has more flexibility, and it's not much harder to code a simple animation with it than Animator.

(* some plots to animate *)
g = Table[Plot3D[Exp[-x^2 - a y^2], {x, -1, 1}, {y, -1, 1}], {a, 81}];

Manipulate[Labeled[
  Show[g[[i]],
   ViewPoint -> {Sin[t], -2.4 + Sin[t]/2, 2*Sin[t]}],
  s[i], Top],
 {i, 1, 81, 1, Animator,
  AnimationRunning -> False, DefaultDuration -> 20,
  AppearanceElements -> {"ProgressSlider", "PlayPauseButton", 
    "FasterSlowerButtons", "DirectionButton"}},
 {t, 0, Pi, Animator,
  AnimationRunning -> False, DefaultDuration -> 32,
  AppearanceElements -> {"ProgressSlider", "PlayPauseButton", 
    "FasterSlowerButtons", "DirectionButton"}},
 PreserveImageOptions -> False]

Mathematica graphics

$\endgroup$

Your Answer

By clicking “Post Your Answer”, you agree to our terms of service and acknowledge you have read our privacy policy.

Not the answer you're looking for? Browse other questions tagged or ask your own question.