11
$\begingroup$

I have a list of data, and I interpolate it to a function. Then I need to do an integration with the interpolating function. But I found that the speed is unacceptably slow.

My data is here (a little long, but don't go away :) ):

data = {-0.00799443, -0.00581522, -0.00557107, -0.00543862, -0.00528042, \
-0.00508618, -0.00486091, -0.00461279, -0.00435009, -0.00408028, \
-0.0038098, -0.00354416, -0.00328805, -0.00304535, -0.00281906, \
-0.0026108, -0.00242045, -0.00224588, -0.00208332, -0.00192845, \
-0.00177801, -0.00163133, -0.00149092, -0.00136145, -0.0012474, \
-0.00115024, -0.00106716, -0.000992246, -0.000919878, -0.000848073, \
-0.000779184, -0.000717175, -0.000663667, -0.000616407, -0.00057173, \
-0.000528424, -0.000488614, -0.000454547, -0.000425288, -0.000397686, \
-0.000370268, -0.00034446, -0.000321488, -0.00030009, -0.000278782, \
-0.000258483, -0.000240725, -0.000224931, -0.000209972, -0.000196452, \
-0.000184918, -0.000174195, -0.000163592, -0.000153752, -0.000144418, \
-0.000134884, -0.000125771, -0.000117444, -0.000109436, -0.000102175, \
-0.0000959463, -0.0000902133, -0.000085125, -0.0000806452, \
-0.0000762082, -0.0000719591, -0.0000677566, -0.000063368, \
-0.0000591507, -0.0000549953, -0.0000510613, -0.0000475951, \
-0.0000444333, -0.0000417897, -0.0000394736, -0.0000373836, \
-0.0000354749, -0.0000334705, -0.0000314543, -0.0000292503, \
-0.0000269879, -0.0000247026, -0.0000224853, -0.0000204942, \
-0.0000187118, -0.0000172668, -0.0000160166, -0.0000149913, \
-0.0000139883, -0.0000129844, -0.000011827, -0.0000105289, \
-9.06132*10^-6, -7.50783*10^-6, -5.94092*10^-6, -4.46213*10^-6, \
-3.15097*10^-6, -2.0399*10^-6, -1.13236*10^-6, -3.57489*10^-7, 
 3.57489*10^-7, 1.13236*10^-6, 2.0399*10^-6, 3.15097*10^-6, 
 4.46213*10^-6, 5.94092*10^-6, 7.50783*10^-6, 
 9.06132*10^-6, 0.0000105289, 0.000011827, 0.0000129844, \
0.0000139883, 0.0000149913, 0.0000160166, 0.0000172668, 0.0000187118, \
0.0000204942, 0.0000224853, 0.0000247026, 0.0000269879, 0.0000292503, \
0.0000314543, 0.0000334705, 0.0000354749, 0.0000373836, 0.0000394736, \
0.0000417897, 0.0000444333, 0.0000475951, 0.0000510613, 0.0000549953, \
0.0000591507, 0.000063368, 0.0000677566, 0.0000719591, 0.0000762082, \
0.0000806452, 0.000085125, 0.0000902133, 0.0000959463, 0.000102175, \
0.000109436, 0.000117444, 0.000125771, 0.000134884, 0.000144418, \
0.000153752, 0.000163592, 0.000174195, 0.000184918, 0.000196452, \
0.000209972, 0.000224931, 0.000240725, 0.000258483, 0.000278782, \
0.00030009, 0.000321488, 0.00034446, 0.000370268, 0.000397686, \
0.000425288, 0.000454547, 0.000488614, 0.000528424, 0.00057173, \
0.000616407, 0.000663667, 0.000717175, 0.000779184, 0.000848073, \
0.000919878, 0.000992246, 0.00106716, 0.00115024, 0.0012474, \
0.00136145, 0.00149092, 0.00163133, 0.00177801, 0.00192845, \
0.00208332, 0.00224588, 0.00242045, 0.0026108, 0.00281906, \
0.00304535, 0.00328805, 0.00354416, 0.0038098, 0.00408028, \
0.00435009, 0.00461279, 0.00486091, 0.00508618, 0.00528042, \
0.00543862, 0.00557107, 0.00581522, 0.00799443}

Interpolate it:

f = Interpolation[data];
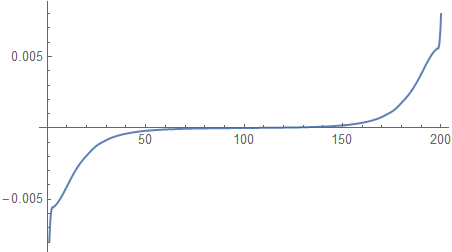
Plot[f[x], {x, 1, 200}, PlotRange -> All]

It looks like:

interpolating function plot

Now I define a function:

Clear[b];
b[x_, y_] := NIntegrate[
   Cross[{0, f[s], 0}, {x - s, 0, y}][[{1, 3}]]/((x - s)^2 + y^2),
   {s, 1, 200}
];

The integration is so slow!!

b[1., 2.] // AbsoluteTiming

(*{1.17772, {-0.00827965, -0.0104805}}*)

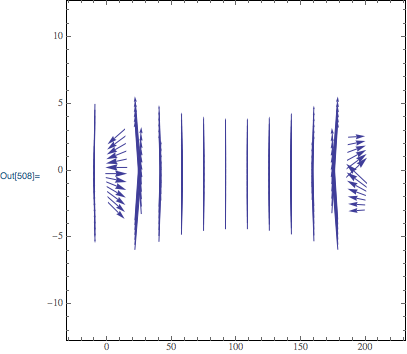
What I want to do is a vector plot:

VectorPlot[b[x, y], {x, -10, 210}, {y, -3, 3}]

But with this kind of slow integration, this is painful. Are there better ways to speed up the integration?

$\endgroup$
1

4 Answers 4

13
$\begingroup$

The way to deal with this is to use the special setting Method -> "InterpolationPointsSubdivision" of NIntegrate[], which will automagically split the integrand so that an integration rule (by default, "GlobalAdaptive") is only applied within each piecewise polynomial interval of the InterpolatingFunction[] involved. This is akin to the functionality of the old package NumericalMath`NIntegrateInterpolatingFunct`​.

As a demonstration:

With[{x = 5, y = 5}, 
     NIntegrate[Cross[{0, f[s], 0}, {x - s, 0, y}][[{1, 3}]]/((x - s)^2 + y^2),
                {s, 1, 200}]] // AbsoluteTiming
   {0.619479, {-0.00929476, -0.00291246}}

With[{x = 5, y = 5}, 
     NIntegrate[Cross[{0, f[s], 0}, {x - s, 0, y}][[{1, 3}]]/((x - s)^2 + y^2),
                {s, 1, 200}, Method -> "InterpolationPointsSubdivision"]] // AbsoluteTiming
   {0.0798281, {-0.00929476, -0.00291246}}

Options[NIntegrate`InterpolationPointsSubdivision] displays the suboptions that can be fed to this method.

$\endgroup$
8
  • $\begingroup$ Hi, J.M. This option works like magic. But I still don't understand how does it work. For example Options[NIntegrate`InterpolationPointsSubdivision] has option MaxSubregion->1000, what does it mean? To split the region into 1000 piece? And how does this makes interpolation function be integrated faster? Is the calculation times being reduced? $\endgroup$
    – matheorem
    Commented May 25, 2016 at 5:57
  • 1
    $\begingroup$ It is only $C^1$ continuous, at the least. $\endgroup$ Commented May 25, 2016 at 6:26
  • 1
    $\begingroup$ Yes, unless the number of intervals exceeds the MaxSubregion setting. $\endgroup$ Commented May 25, 2016 at 12:40
  • 1
    $\begingroup$ @J.M. Awesome! The InterpolationPointsSubdivision option is not mentioned under the Details and Options section but is present in the Method -> Symbolic Processing section. Very happy to learned about this possibility. You get my vote. $\endgroup$ Commented May 25, 2016 at 22:42
  • 1
    $\begingroup$ @Jack, yes, it's tucked somewhere deep in the advanced documentation… one can be forgiven for not easily encountering it. :) $\endgroup$ Commented May 25, 2016 at 23:53
6
$\begingroup$

An alternative to using NIntegrate is to convert the integral into an ODE, and then use NDSolveValue or ParametricNDSolveValue. For example:

pf = ParametricNDSolveValue[
    {
    {u'[s], v'[s]} == Cross[{0,f[s],0}, {x-s,0,y}][[{1,3}]]/((x-s)^2+y^2),
    u[1]==0, v[1]==0
    },
    {u[200], v[200]},
    {s, 1, 200},
    {x, y}
]; 

Compare:

b[1, 2] //AbsoluteTiming
pf[1, 2] //AbsoluteTiming

{1.11616, {-0.00827965, -0.0104805}}

{0.004751, {-0.00827962, -0.0104802}}

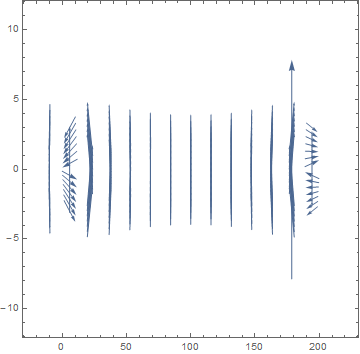
Over 200 times faster with basically the same result. VectorPlot visualization:

VectorPlot[
    pf[x, y],
    {x, -10, 210},
    {y, -3, 3},
    VectorPoints -> {14, 14}
]

enter image description here

$\endgroup$
4
$\begingroup$

If you are willing to accept some error you can get a faster result by fitting the data to function.

Other than at each extreme the data looks like a shifted and scaled Sinh function.

Using your data (i.e., not re-copied)

sol = FindFit[data, 
  a Sinh[(x - x0)/b], {{a, 0.000015}, {b, 15}, {x0, 100}}, x]

(* {a -> 0.0000140493, b -> 14.3721, x0 -> 100.5} *)

Using the results define

f[x_] := 1.405*10^-5 Sinh[(x - 100.5)/14.37]

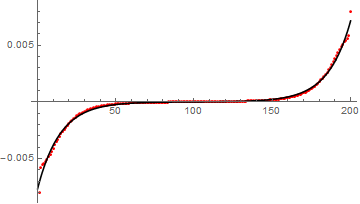
Here is the comparison

Show[
 ListPlot[data, PlotStyle -> Red, PlotRange -> All],
 Plot[f[x], {x, 0, 200}, PlotStyle -> Black, PlotRange -> All]

 ]

Mathematica graphics

I think I had to make sure that the inputs to b were numerical.

b[x_?NumericQ, y_?NumericQ] := NIntegrate[
  Cross[{0, f[s], 0}, {x - s, 0, y}][[{1, 3}]]/((x - s)^2 + y^2),
   {s, 1, 200}]

Using a fitted function enables you to pick up some speed (a factor ~ 80)

b[1., 2.] // AbsoluteTiming

(* {0.0143029, {-0.00872379, -0.0107461}} *)

and plot the vector plot (still slow, but not too painful).

Mathematica graphics

If you find the error is too great you could try a Piecewise function and use the Sinh in the middle and fit a separate function at the end points. Looks like two lines on the right from 185 to 199 and 199 to 200 and on the left another two lines from 1 to 2 and 2 to 15 blended in with the Sinh.

I didn't try it so I don't know how it would affect performance.

Good luck!

$\endgroup$
2
  • $\begingroup$ Wow, you really captured the essential feature of my data. Your approach is really fast and the result is almost the same as accurate calculation. Great insight ! What is more, I tried Piecewise but found it generally harm the performance. $\endgroup$
    – matheorem
    Commented May 25, 2016 at 5:51
  • $\begingroup$ If it's really Sinh around 100.5, the integral is essentially odd about the middle of the domain. The integral will be very very small as a result of large cancellations (and that may signal that your data is insufficient to get a good answer). $\endgroup$
    – evanb
    Commented May 27, 2016 at 19:34
1
$\begingroup$

If results with lower precision goals are satisfactory (which is an assumption in couple of the answers) then using NIntegrate with a combination of option settings for Method and PrecisionGoal can produce results much quicker.

In the table below the first two options settings are the same as in J.M.'s answer. We can see that the last one is 100 times and 10 times quicker respectively.

opts = {{}, 
   Method -> 
    "InterpolationPointsSubdivision", {Method -> {Automatic, 
      "SymbolicProcessing" -> 0}, PrecisionGoal -> 3}};

res =
  Table[
   With[{x = 5, y = 5, o1 = o},
    Prepend[
     AbsoluteTiming[
      NIntegrate[
       Cross[{0, f[s], 0}, {x - s, 0, y}][[{1, 3}]]/((x - s)^2 + 
          y^2), {s, 1, 200}, o1]], o1]
    ],
   {o, opts}];
TableForm[res, 
 TableHeadings -> {None, {"Options", "AbsoluteTiming", "Result"}}] 

enter image description here

$\endgroup$

Your Answer

By clicking “Post Your Answer”, you agree to our terms of service and acknowledge you have read our privacy policy.

Not the answer you're looking for? Browse other questions tagged or ask your own question.