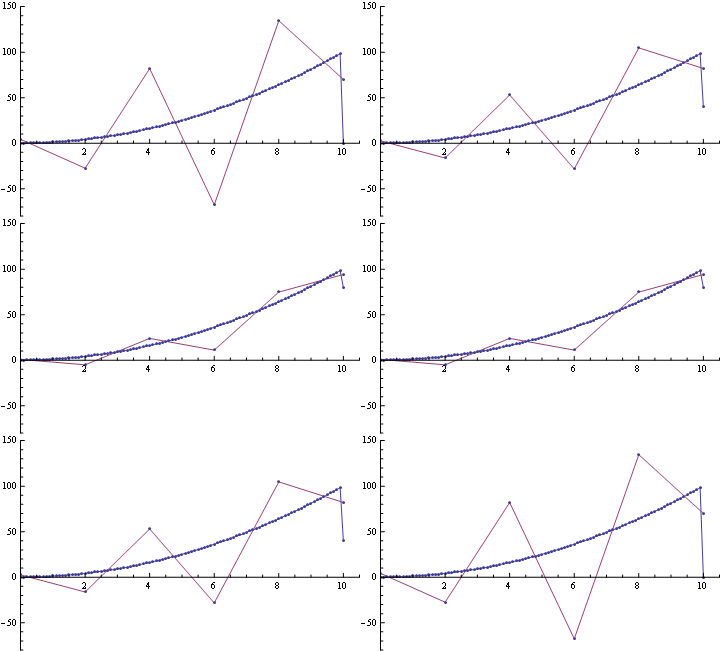
Continuation Manipulate function to generate outliers
I want to call a function in the manipulate environment so that the changing data is fed to another function and both the plots are plotted in a superimposed fashion. This is what i did.
lsqcurve[data_, degree_] :=
   Module[{m, knot, vandermonde, bez, dplot, bezpolyplot, n},
   m = Length[data] - 1;
   n = degree;
   knot = Table[t, {t, 0.0, 1.0, 1/m}];
   vandermonde =
   Table[BernsteinBasis[n, j - 1, knot[[i]]], {i, 1, m + 1}, {j, 1,
   n + 1}];
   bez = LinearSolve[Transpose[vandermonde].vandermonde,
   Transpose[vandermonde].data];
   Return[bez];]
n = 100;
data3 = Table[{t, t^2 + 0.4 RandomReal[]}, {t, 0.0, 10.0, 10/n}];

point = Part[data3, 50];
Manipulate[ListPlot[ReplacePart[data3, {50, 2} -> i]], {i, 0.`, 100},lsqcurve[data3,5]]
This is not giving expected output

