7
$\begingroup$

I want to have two groups of $n$ random numbers $u_i$ and $v_i$ in $U(0,1)$, such that $\sum u_i = \sum v_i$

What I tried is:

I can firstly get $u_i$ by RandomReal[{0,1},n], make $s=\sum u_i$.

Then I found it is very difficult to generate another $n$ uniformly distributed random numbers $v_i$ from $U(0,1)$ that sum to $s$, where $s$ is a real value in $[0,n]$. I can scale it but need to reject many cases that $v_i$ is larger than 1, I guess.

Try to make the question clearer, my original problem is:

I have $8$ parameters $\kappa_i, i=1,\ldots,8$ from a system, each parameter $\kappa_i$ can be any value in $[0,1]$. But I have a constraint on my parameters which is $\kappa_1+\kappa_2+\kappa_3+\kappa_4=\kappa_5+\kappa_6+\kappa_7+\kappa_8$. Now I want to sample the whole parameter space (is this counted as Monte Carlo?) with such constraint. What should I do?

Update:

I have used @Coolwater 's method, but the problem is that rejecting any values larger than 1 costs a lot. When I want to sample 10,000 sets, it costs me hours. By the time I update this post, it is still running.

Any ideas about how to do this efficiently?

More update: @JasonB 's approach perfectly solved my problem. Actually, it makes sense that just scale the larger group based on the two sums ratio!!! I was too stupid to come out with this idea, which is very intuitive and straightforward!

$\endgroup$
17
  • $\begingroup$ this, and do a rescale maybe? $\endgroup$ Commented Feb 5, 2016 at 13:09
  • 1
    $\begingroup$ Will they not have to have an expected sum of n/2 or they cannot be U[0,1] distributed? $\endgroup$
    – Ymareth
    Commented Feb 5, 2016 at 13:47
  • 6
    $\begingroup$ I am not sure you realize that the question, as stated, makes no sense. If they are truly uniformly distributed then they (very likely) won't sum to a given value. If you put in a constraint, such as "they must sum to 1", then the question is: what do you mean by random? No, this is not nitpicking. It's a very common mistake when thinking about what "random" means, see e.g. Bertrand's paradox. Before the question can be answered you will need to decide what you really mean when you say "random numbers" and how the constraint impacts on that. $\endgroup$
    – Szabolcs
    Commented Feb 5, 2016 at 16:26
  • $\begingroup$ Here's a related question where the answer shows how different interpretations of the question will lead to very different distributions. mathematica.stackexchange.com/q/33652/12 $\endgroup$
    – Szabolcs
    Commented Feb 5, 2016 at 16:39
  • 2
    $\begingroup$ I have voted to close as unclear with the following reasoning: the posted answers all seem to interpret the question differently (i.e. propose different distributions). This is good evidence that before allowing more answers, the question should be put into a clearer form. How to do that is a good and interesting question in itself but as Jim said it is more suitable to Math.SE. $\endgroup$
    – Szabolcs
    Commented Feb 6, 2016 at 9:32

4 Answers 4

6
$\begingroup$

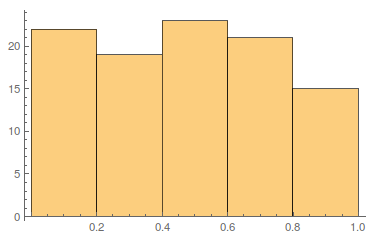
If you want two lists to have the same Total, then you need to scale one of them by the right amount. The trick is to pick which one to scale so that both of the lists are within $U(0,1)$

n=2000;
lists = RandomReal[1, {n, 2}] // Transpose;
lists = lists (Min[Total /@ lists]/Total@# & /@ lists);

Now you verify that they are both from the right distribution and have the same sum,

MinMax /@ lists
Total /@ lists
Histogram /@ lists
(* {{0.0000306034, 0.999652}, {0.0000765896, 0.992954}} *)
(* {999.074, 999.074} *)

enter image description here

As Coolwater points out, this does skew the distribution of sums, due to the fact that we are always choosing the smaller sum. You can do away with this by replacing Min[Total /@ lists] with Total[lists[[1]]], but then you have the problem that some small portion of your lists will be outside the range $U(0,1)$. I'm no statistician, but it seems that generating that second list which is both uniformly distributed and has a given sum isn't a problem with a solution. The above is pretty close though.

Looking around on the web, a common recipe given to generate a uniform random list with a given sum is [(quoting from here, but you find the same procedure here and here)

Generate N-1 random numbers between 0 and 1, add the numbers 0 and 1 themselves to the list, sort them, and take the differences of adjacent numbers.

So lets say I make list1, which has 100 elements and a given sum:

list1 = RandomReal[1, 100];
sum = Total@list1
Histogram@list1
(* 48.1 *)

enter image description here

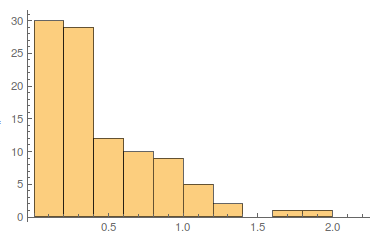
Now I follow that recipe to make another list, again with 100 elements between 0 and 1, whose sum is the same as list1

list2 = 
  sum Differences@Sort@Join[RandomReal[1, 99], {0, 1}];
Total@list2
Histogram@list2
(* 48.1 *)

enter image description here

Clearly list2 is neither drawn from a uniform distribution, nor confined to the interval [0,1]

$\endgroup$
4
  • $\begingroup$ Note that this approach doesn't cause the sums to follow the UniformSumDistribution[n], because the smallest sum is chosen every time. QuantilePlot[Sort[Table[(lists = RandomReal[1, {20, 2}] // Transpose; lists = lists (Min[Total /@ lists]/Total@# & /@ lists); Total[First[lists]]), {200}]], UniformSumDistribution[20], Method -> {"ReferenceLineMethod" -> "Diagonal"}] $\endgroup$
    – Coolwater
    Commented Feb 5, 2016 at 13:08
  • $\begingroup$ That isn't what was asked for in the question. As I understood the question, OP needs two lists that have the same sum, both of which have a uniform distribution between 0 and 1. This does that. I literally cannot get your code to run so I can't even evaluate it. $\endgroup$
    – Jason B.
    Commented Feb 5, 2016 at 13:18
  • $\begingroup$ @JasonB The question is not well stated (or rather: contradictory), see my comments above. $\endgroup$
    – Szabolcs
    Commented Feb 5, 2016 at 16:41
  • $\begingroup$ Thanks very much! I think this is the best solution! Appreciate it! $\endgroup$
    – LifeWorks
    Commented Feb 10, 2016 at 15:07
1
$\begingroup$

Here is an approach to produce a good approximation. Brute force generate lots of distributions until we achieve the desired total:

target = Total@RandomReal[1, {1000}]

511.315

set2 = NestWhile[  Append[ Rest@#, RandomReal[1]] &, 
   RandomReal[1, {1000}],
   Abs[Total[#] - target] > .0001 &];
Total@set2

511.315

% - target

-0.0000451315

Alternately if we want two sets with the same total, as opposed to generating one and trying to match it, we can do this:

m = SortBy[RandomReal[1, {50000, 1000}] , Total ];
sets = m[[# ;; # + 1]] &@First@Ordering[Abs[Differences[Total /@ m]]];
{Total@sets[[1]], Total@sets[[2]], Total@sets[[1]] - Total@sets[[2]]}

{493.849, 493.849, -1.66665*10^-9}

This is of course biasing the total to be close to the expected value.

$\endgroup$
1
$\begingroup$

Let $U,V\sim U\left(0,\,1\right)$ be two iid standard uniform random variables. Sample $n$ times from $U$ and denote the sum by $s_{x} := \sum_{k=1}^{n} u_{k}$. Note that this sum $s_{1}$ has the Irwin–Hall distribution, which is defined to be the sum of iid standard uniform random variables.

I understand your question in the following way: You are asking for one realization of $n$ random variables $Y_{k}$, which have the conditional joint distribution that they sum to $s_{x}$ and are individually unconditional $Y_{k}\sim U\left(1,\,0\right)$ iid.

Some thoughts for the case $n=2$:

In Expectation we have $s_{x}=1$.

Let us assume that $s_{x}\leq 1$, for instance $s_{x}=0.8$.

So we are searching for two numbers which sum to $0.8$. Note that this problem has only $n-1=1$ Degree of Freedom: After we are given the first realization $y_{1}$ the last realization $y_{2}$ is uniquely determined by the requirement that $y_{1}+y_{2}=s_{x} \iff y_{2}=s_{x}-y_{1}$.

Because of the requirement that the sum is $s_{x}=0.8$, we can only sample $Y_{1}$ from $U\left(0,\,0.8\right)$.

Let us assume that $s_{x}\geq 1$, for instance $s_{x}=1.8$.

In the second and last step the maximal possible realization of $y_{2}$ is $1$. So in order to get to a sum of $s_{x}=1.8$ we have to sample $Y_{1}$ from $U\left(0.8,\,1\right)$.

Some thoughts for general $n$:

In the last $m$ realizations we can get a maximal sum of $y_{n-m+1}+\ldots+y_{n}=m$ and a minimal sum of $0$. So if there are $m$ realizations left we have to be in a position that the running sum $s_{y}^{\left( n-m+1\right)}:=\sum_{k=1}^{n-m}y_{k}$ is at least $s_{x}-m$.

Mathematica function

The following function implements this idea.

ClearAll[UnifCondOnSum]
UnifCondOnSum[sx_?NonNegative, n_?IntegerQ] := 
  Block[{sy = 0, y = ConstantArray[0, Length@x]},
   For[i = Length@x, i >= 2, i--,
    y[[i]] = RandomReal[{Max[0, sx - sy - (i - 1)], Min[1, sx - sy]}];
     sy = sy + y[[i]]
    ];
   y[[1]] = sx - sy;
   y];

Generate the realizations:

SeedRandom[0]
Block[{n = 8}, 
 x = RandomVariate[UniformDistribution[], n];
 v = UnifCondOnSum[Total@x, n];
 {x, v}]
(* {{0.393562, 0.701033, 0.966231, 0.221456, 0.436768}, 
    {0.809425, 0.333722, 0.288053, 0.727646, 0.560204}} *)

Check there respective sums:

Total /@ {x, v}
(* {2.71905, 2.71905} *)

You could also generate the sum $s_{x}=s_{y}$ by the Irwin–Hall distribution and generate both, $\left(x_{k}\right)_{k=1}^{n}$ and $\left(y_{k}\right)_{k=1}^{n}$ with UnifCondOnSum.

This method generates $10^{5}$ samples of $X$ and $Y$ nearly instantaneous because it is a direct method.

Disclaimer: I hope I did not mess up the indices.

$\endgroup$
0
$\begingroup$

Someone can maybe implement the following idea:

It is enough to be able to produce a list of $n$ random numbers in range $[0,1]$ with total sum $s$, where the random numbers are chosen in some uniform (fair) fashion.

Note that picking a random vector in $C=[0,1]^n$ is the same as sampling a hypercube. We can intersect this hypercube with the plane $L_s:x_1+\dotsb+x_n =s$, and sample $L \cap C$ with a uniform measure. Thus, all variables are identically distributed, but they are not independent (I think)...

Now, once we know how to pick a vector in $C \cap L_s$ at random, we first pick $s$ with the same distribution as a sum of $n$ iid uniform random variables, and then pick two vectors from $C \cap L_s$. They will by construction have the same sum, and all variables are identically distributed random variables.

However, they are probably not independent (not inside the vector, not between vectors either).

$\endgroup$
1
  • 1
    $\begingroup$ To answer your comment, and others too: if you carry out this procedure and then look at the histogram of $x_1$, it won't be flat at all. What does the OP then mean by asking that "they be in $U(0,1)$"? We can reverse it too: if we enforce the flat histogram, and also enforce that they sum to $s$, what does it mean that they are "random" (see reference to Bertrand's paradox). It seems to me that the OP did not understand these issues well when asking the question, and thus ended up with an unclear phrasing. That's well demonstrated by all the answers here proposing different distributions. $\endgroup$
    – Szabolcs
    Commented Feb 6, 2016 at 8:41

Not the answer you're looking for? Browse other questions tagged or ask your own question.