Clear@pw

pw[x_, y_] := -HurwitzZeta[1 - y, 1/2 + x] y
With negative x-values you get many complex numbers and indeterminate values. For example:
pw[-3., -2.5] // N
29.052 + 28.9903 I
pw[-3., 0.] // N
Indeterminate
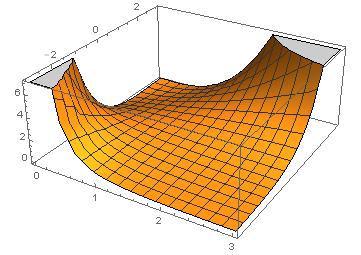
Avoiding negative x-values gives the following plot
Plot3D[pw[x, y], {x, 0, 3}, {y, -3, 3}]

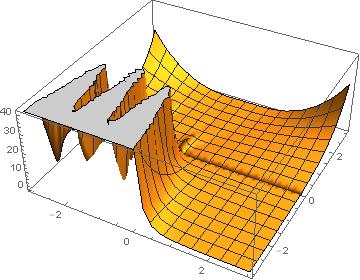
If you want to plot negative x-values you must skip the 0 by choosing a plot range of f.e. {-3.01, 3.01} and you can convert the complex numbers with Abs
Plot3D[Abs @ pw[b, p], {b, -3.01, 3.01}, {p, -3.01, 3.01}]

From the documentation:
Unlike Zeta, HurwitzZeta has singularities at a==-n for non-negative
integers n ... HurwitzZeta has branch cut discontinuities in the
complex a plane running from 0 to -Infinity.


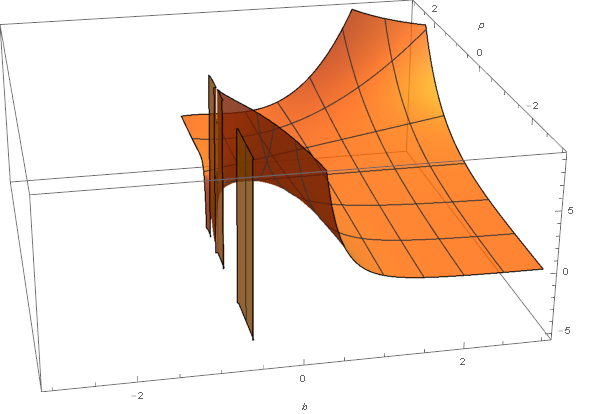
PlotPoints -> AutomaticImo it's not a good idea to use ` ClippingStyle -> None` here $\endgroup$Plot3D[pw[b, p], {b, 0, 3}, {p, -6, 6}]$\endgroup$Table[pw[b, p], {b, -3, 3, 1.}, {p, -3, 3, 1.}]. Error messages and indeterminate values! $\endgroup$