3
$\begingroup$

I guess this is more of an informatic question. A quite complicated function of mine generates me a list of valid points, depending on a parameter, like this:

valid[g_?NumericQ] := Table[g^(i/6), {i, If[g < 1.5, 2, If[g < 2, 4, 6]]}]

valid[1]
{1, 1}

valid[1.3]
{1.0447, 1.09139}

valid[1.6]
{1.08148, 1.16961, 1.26491, 1.36798}

valid[2.1]
{1.13163, 1.28058, 1.44914, 1.63988, 1.85574, 2.1}

So the number of valid points is variable (between 2 and 6). So what I want to do now is to plot these efficiently. What I inefficiently did was

v1=DiscretePlot[valid[g][[1]],{g,1,3,0.01}]
v2=DiscretePlot[valid[g][[2]],{g,1,3,0.01}]
v3=DiscretePlot[valid[g][[3]],{g,1,3,0.01}]
v4=DiscretePlot[valid[g][[4]],{g,1,3,0.01}]
v5=DiscretePlot[valid[g][[5]],{g,1,3,0.01}]
v6=DiscretePlot[valid[g][[6]],{g,1,3,0.01}]
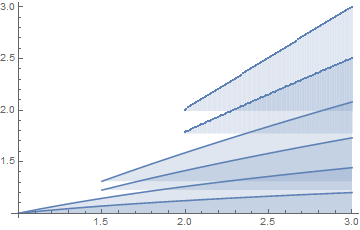
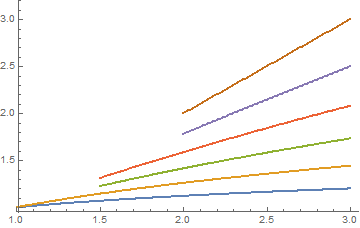
Show[v1, v2, v3, v4, v5, v6, PlotRange -> {{1, 3}, {1, 3}}]

which, as you can imagine, takes quite a while, since Mathematica has to calculate valid[g] six times instead of one. I played around with Module, but that didn't work out for me. As a clarification, what "Show" gives me is pretty much what I want; I just would like a more efficient solution.

EDIT:
Ok, so what I do now, I let him generate the Table with all values once:

valid[g_?NumericQ] := PadRight[Table[g^(i/6), {i, If[g < 1.5, 2, If[g < 2, 4, 6]]}],6,Missing[]]

validg = Table[ valid[g],{g,1,3,0.01}]

and then I do the partial DiscretePlots:. Ok, that should work! Thank you all :)

EDiT2: Though i'm fine with the solution, you might not be, so i'll give a further constraint: i can not really change "valid[]", but have to work with it's output, since it is based on this: Updating Wagon's FindAllCrossings2D[] function

$\endgroup$
14
  • $\begingroup$ valid[1.5] will not have a third element, so valid[1.5][[3]] should not work in your plot, no? Consider using Indeterminate or Missing[] to fill in for invalid outputs, which can then be handled by plotting functions. $\endgroup$ Commented Oct 28, 2015 at 15:55
  • $\begingroup$ Works actually. Mathematica just seems to fill the Missings with Nulls. $\endgroup$
    – Peter
    Commented Oct 28, 2015 at 15:55
  • $\begingroup$ My point was that you might want to set valid to always output a list with six elements, and use something for filling in "invalid" values. $\endgroup$ Commented Oct 28, 2015 at 15:58
  • $\begingroup$ I am unclear on what you are trying to do, but would this work? values = Table[valid[g], {g, 0, 1, 0.01}]; ListPlot[values] $\endgroup$
    – MarcoB
    Commented Oct 28, 2015 at 16:01
  • $\begingroup$ Ok, yeah, that might help, especially since i'll probably have to sort the points in a way so i can colourkey connected results... will do that, thanks. $\endgroup$
    – Peter
    Commented Oct 28, 2015 at 16:01

1 Answer 1

3
$\begingroup$

Update

As I now understand your question the function valid is sort of pseudo-code for the purpose of asking the question.

The output that you are dealing with is a ragged list that may have two, four or six elements.

Starting with the original valid we generate a ragged list.

valid[g_?NumericQ] := Table[g^(i/6), {i, If[g < 1.5, 2, If[g < 2, 4, 6]]}]

raggedList = Table[{g, valid[g]}, {g, 1, 3, 0.01}];

This operation is efficient and generates all of the required data but the data can't be directly plotted.

One can use Reap and Sow to efficiently gather the data to plot.

The code below is verbose and I am quite certain it could be made significantly shorter but for the purpose of communicating I like to start with something that is easy to follow.

Essentially what we are doing is gathering data so that we can use ListPlot directly on the output.

out =
 Flatten[
  Reap[
    Map[
     Function[element,
      Which[Length[element[[2]]] == 6,
       Sow[{element[[1]], element[[2, 1]]}, 1];
       Sow[{element[[1]], element[[2, 2]]}, 2];
       Sow[{element[[1]], element[[2, 3]]}, 3];
       Sow[{element[[1]], element[[2, 4]]}, 4];
       Sow[{element[[1]], element[[2, 5]]}, 5];
       Sow[{element[[1]], element[[2, 6]]}, 6];
       ,
       Length[element[[2]]] == 4,
       Sow[{element[[1]], element[[2, 1]]}, 1];
       Sow[{element[[1]], element[[2, 2]]}, 2];
       Sow[{element[[1]], element[[2, 3]]}, 3];
       Sow[{element[[1]], element[[2, 4]]}, 4];
       ,
       Length[element[[2]]] == 2,
       Sow[{element[[1]], element[[2, 1]]}, 1];
       Sow[{element[[1]], element[[2, 2]]}, 2]
       ]
      ],
     list
     ],
    {1, 2, 3, 4, 5, 6}][[2]],
  1]

out can be directly plotted with ListPlot

ListPlot[out, PlotRange -> {{1, 3.05}, {0.95, 3.2}}]

Mathematica graphics

Original

Your question is about efficiency.

Currently you get a good answer but are making more computations than are required.

valid is used to generate lists of length 2, 4 and 6 and then you make six DiscretePlots by extracting the first and second columns from all 201 lists, the third and fourth from lists 51 to 201 and the fifth and sixth from lists 101 to 201 and make a discrete plot of each.

For this specific problem you can write a modified valid that will only compute what is needed based upon the value of i in your table (1 thru 6).

valid2[i_] := DiscretePlot[g^(i/6.),
  {g, Which[i < 3, 1, i < 5, 1.5, True, 2], 3, 0.01}]

The trick here is to set the starting value for g to be dependent upon i.

Using this function we can plot all of the data in one fell swoop

Show[
 Map[valid2[#] &, Range[6]],
 PlotRange -> All
 ]

which produces

Mathematica graphics

$\endgroup$
3
  • $\begingroup$ Thank you for your answer. Unfortunately, in the original problem i do not know the exact spot from when on 2, 4 or 6 values appear. Also changing the structure "valid" is not really an option, as it is based on this: mathematica.stackexchange.com/questions/275/… $\endgroup$
    – Peter
    Commented Oct 29, 2015 at 11:46
  • $\begingroup$ @Peter - I have updated the answer to work with ragged lists with lengths that may be 2, 4 or 6 elements in length. $\endgroup$ Commented Oct 29, 2015 at 19:06
  • $\begingroup$ Really awesome! I stumbled over Sow and Reap a while a go but never really got their purpose. Will work with that. Thank you very much! $\endgroup$
    – Peter
    Commented Oct 31, 2015 at 9:00

Your Answer

By clicking “Post Your Answer”, you agree to our terms of service and acknowledge you have read our privacy policy.

Not the answer you're looking for? Browse other questions tagged or ask your own question.