0
$\begingroup$

So let me start by stating I'm really new to Mathematica.
Being a biologist..
I'm trying to make two different loops.
And I've been googling around and looking at some youtube video.
But, I'm getting a bit stressed out so;

I'm trying to make a sine loop and a "special" sine function---where the later one is a big struggle in how to implement it to Mathematica.

For the sine loop my logical thought is;

t==0; while t< Ssk1 do t+0.0001; if t>Skk1 stop; then do t-0.0001; until t==0; then do t+0.0001; where Ssk1==0.02675

I would get a sinus loop, right?

The purpose of the special function is to have a break. Where nothing happens. So here my thinking is;

t==0.00001;
while t<Ssk1 do t+0.00001; if t>=0 then do nothing for 300; then do t+0.00001
.

My issue is putting it in Mathematica language. I just can't. I think some simple examples of reasoning will get me going.

And I do apologies if this is a bad or stupid question. Sorry.

$\endgroup$
3
  • $\begingroup$ Welcome to Mathematica.SE! I hope you will become a regular contributor. To get started, 1) take the introductory tour now, 2) when you see good questions and answers, vote them up by clicking the gray triangles, because the credibility of the system is based on the reputation gained by users sharing their knowledge, 3) remember to accept the answer, if any, that solves your problem, by clicking the checkmark sign, and 4) give help too, by answering questions in your areas of expertise. $\endgroup$
    – bbgodfrey
    Commented Oct 23, 2015 at 21:42
  • $\begingroup$ Your question is not stupid, but it is a bit difficult to follow. $\endgroup$
    – bbgodfrey
    Commented Oct 23, 2015 at 21:45
  • 1
    $\begingroup$ Triangle wave actually. Try the following. ssk1 = 0.02675; up1 = Table[t, {t, 0, ssk1, .0001}]; down1 = Table[t, {t, ssk1, 0, -.0001}]; up2 = Table[t, {t, 0, ssk1, .0001}]; down2 = Table[t, {t, ssk1, 0, -.0001}]; ListPlot[Join[up1, down1, up2, down2]]. There are better ways to code this but I wanted to make it as close to your pseudocode as possible, so it would be easier to follow. $\endgroup$ Commented Oct 23, 2015 at 22:35

1 Answer 1

5
$\begingroup$

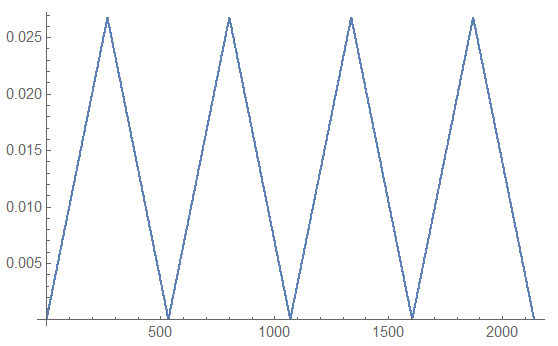
As alluded to by Daniel Lichtblau you could use TriangleWave with appropriate scaling, e.g.

amp = 0.02675;
per = 4 amp/0.0001;
DiscretePlot[Abs@TriangleWave[{-amp, amp}, x/per], {x, 0, 2 per, 1}, 
 Filling -> None]

enter image description here

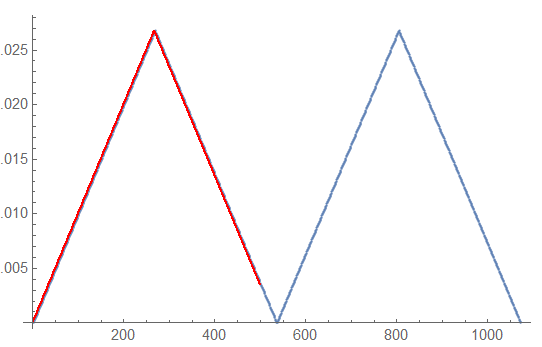
Compared with @DanielLichtblau comment code:

ssk1 = 0.02675; up1 = Table[t, {t, 0, ssk1, .0001}]; down1 = 
 Table[t, {t, ssk1, 0, -.0001}]; up2 = 
 Table[t, {t, 0, ssk1, .0001}]; down2 = 
 Table[t, {t, ssk1, 0, -.0001}]; Show[
 ListPlot[Join[up1, down1, up2, down2]], 
 DiscretePlot[Abs@TriangleWave[{-amp, amp}, x/per], {x, 0, 500, 1}, 
  Filling -> None, PlotStyle -> {Red, Thick}]]

enter image description here

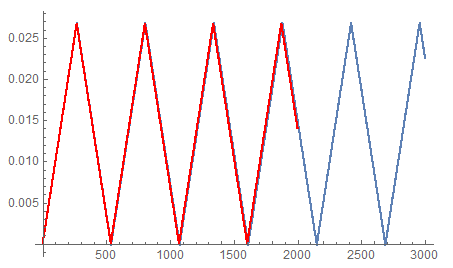
Or you could code a switch when event of interest arises, e.g.

fun[n_] := 
 Module[{s = 1}, 
  NestList[(If[# > 0.02675 || # < 0, s = -s]; #1 + s 0.0001`) &, 
   0.0001, n]]

e.g.

Show[ListPlot[fun[3000]], 
 DiscretePlot[Abs@TriangleWave[{-amp, amp}, x/per], {x, 0, 2000, 1}, 
  Filling -> None, PlotStyle -> {Red, Thick}]]

enter image description here

There are some numerical issues around turning points:

fun[540][[-10 ;; -1]]
fun[270][[-10 ;; -1]]

yield:

{0.0004, 0.0003, 0.0002, 0.0001, 2.43945*10^-19, -0.0001, 2.43945*10^-19, 0.0001, 0.0002, 0.0003} and

{0.0262, 0.0263, 0.0264, 0.0265, 0.0266, 0.0267, 0.0268, 0.0267, \ 0.0266, 0.0265}

respectively

$\endgroup$

Your Answer

By clicking “Post Your Answer”, you agree to our terms of service and acknowledge you have read our privacy policy.

Not the answer you're looking for? Browse other questions tagged or ask your own question.