0
$\begingroup$

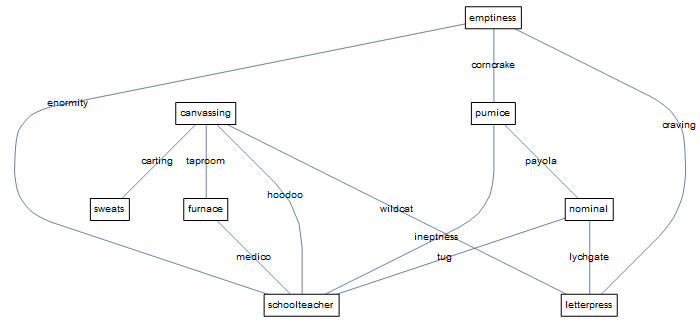
I define a graph of numbers as vertices, but also labeled, like g=Graph[{Labeled[1 \[DirectedEdge] 5, "text1"]…},VertexLabels -> {79 -> "text2",…}]. This is immediately plotted in the output, and that plot is labeled correctly (both vertices and edges, the original numbers used for vertices don't even show up). Then when I plot it with LayeredGraphPlot[g, VertexLabeling -> Tooltip,EdgeLabeling -> Automatic], the numbers showing up as vertex label tooltips are neither the defined labels, nor even the original vertex numbers, but integers (not even in an obvious order). This makes it the plot very misleading and hard to parse. What goes wrong here, and how to do it better?

If I ask for EdgeLabeling too, the edge labels don't show up, so the plot lost them as well. Why?

This behavior is the same with more basic GraphPlot or the more specific LayeredGraphPlot.

See this toy example:

g = Graph[{Labeled[1 \[DirectedEdge] 5, "text1"]}, 
  VertexLabels -> {1 -> "text2", 5 \[DirectedEdge] "text3"}]
LayeredGraphPlot[g, VertexLabeling -> Tooltip, 
 EdgeLabeling -> Automatic]
$\endgroup$
6
  • 1
    $\begingroup$ Can you give a complete example please? $\endgroup$
    – Szabolcs
    Commented Jul 16, 2015 at 11:59
  • $\begingroup$ @Szabolcs Point taken, now you have the working example. $\endgroup$
    – László
    Commented Jul 16, 2015 at 14:21
  • 2
    $\begingroup$ This is likely because *GraphPlot functions are the old way to visualize a graph, from before when Mathematica got a Graph datatype. I'd consider them deprecated. Originally they just took a pair-list or a rule-list, not a Graph. They've been updated to support Graph, but it seems the conversion loses both labels and names, and keeps only vertex indices. You can either convert on your own (Rule@@@EdgeList[g] will be accepted by GraphPlot), or you can use the new way to visualize the graph, SetProperty[g, GraphLayout -> "LayeredEmbedding"]. $\endgroup$
    – Szabolcs
    Commented Jul 16, 2015 at 15:42
  • $\begingroup$ Sorry, no time to dig into this ... that's why this is only a comment. In short, I think the only reason GraphPlot functions are still around is backwards compatibility... $\endgroup$
    – Szabolcs
    Commented Jul 16, 2015 at 15:42
  • 1
    $\begingroup$ Yes, you're right LayeredGraphPlot used to give nicer output ... I'd try converting the graph manually to a format supported by LayeredGraphPlot. $\endgroup$
    – Szabolcs
    Commented Jul 16, 2015 at 18:34

1 Answer 1

2
$\begingroup$
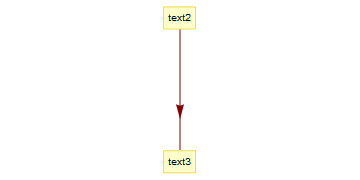
g = Graph[{Labeled[1 -> 5, "text1"]}, 
  VertexLabels -> {1 -> "text2", 5 -> "text3"}]

enter image description here

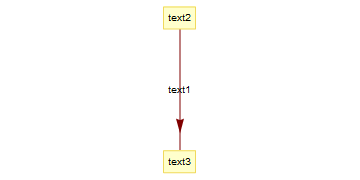
You can use the undocumented option "VertexNames" to add vertex labels in LayeredGraphPlot. Somehow, edge labels are lost when the first argument of LayeredGraphPlot is a graph object:

LayeredGraphPlot[g, VertexLabeling -> All, EdgeLabeling -> True, 
 "VertexNames" -> {"text2", "text3"}]

enter image description here

Using a list of {edge, edgelabel} pairs in the first argument we get the desired result:

LayeredGraphPlot[{Rule @@ #, PropertyValue[{g, #}, EdgeLabels] /. $Failed -> ""} & /@ EdgeList[g], 
  VertexLabeling -> True, EdgeLabeling -> True, "VertexNames" -> {"text2", "text3"}]

enter image description here

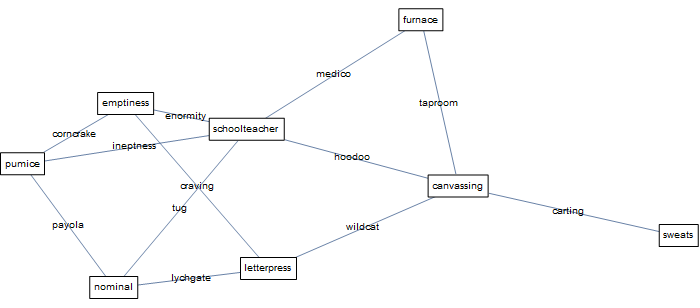
Another example:

SeedRandom[1]
{vlbls, elbls} = RandomWord["Noun", #] & /@ {8, 12};
rg = RandomGraph[{8, 12}];
eLbl = Association[# -> elbls[[EdgeIndex[rg, #]]] & /@ EdgeList[rg]];
vLbl = Association[# -> vlbls[[VertexIndex[rg, #]]] & /@ VertexList[rg]];


g0 = SetProperty[rg, { EdgeLabels -> {e_ :> eLbl[e]}, 
   VertexLabels -> {v_ :> Placed[Framed[vLbl[v], Background -> White], Center]}, 
   ImageSize -> 700}]

enter image description here

LayeredGraphPlot[{Rule @@ #, PropertyValue[{g0, #}, EdgeLabels] /. $Failed -> ""} & /@ EdgeList[g0], 
  VertexLabeling -> All, EdgeLabeling -> True, "VertexNames" -> vlbls, ImageSize -> 700]

enter image description here

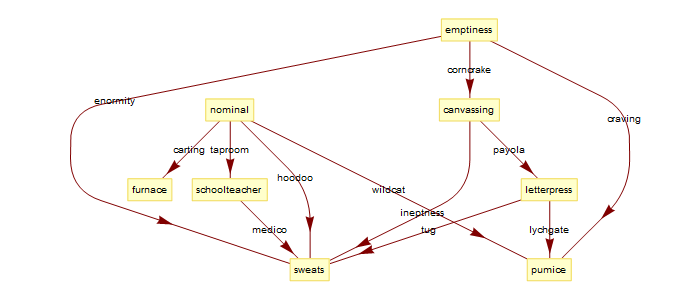
Of course, using Graph with the option GraphLayout -> {"LayeredDigraphEmbedding", "Orientation" -> Top} we get the desired result much more conveniently without the need for LayeredGraphPlot:

SetProperty[g0, 
 GraphLayout -> {"LayeredDigraphEmbedding", "Orientation" -> Top}]

enter image description here

Note: In version 12.0, LayeredGraphPlot is updated with many changes and the above method does not work. To access the legacy version of GraphPlot use the function GraphComputation`LayeredGraphPlotLegacy.

$\endgroup$

Your Answer

By clicking “Post Your Answer”, you agree to our terms of service and acknowledge you have read our privacy policy.

Not the answer you're looking for? Browse other questions tagged or ask your own question.