1
$\begingroup$

Consider the following minimal example:

delta = 0.00001;
data = Block[{x = RandomReal[], y = RandomReal[]},
    Table[{x + RandomReal[] delta, y + RandomReal[] delta, RandomInteger[100]},
        {i, 1, 100}]];

ListPlot3D[data, PlotRange -> All]

The plot doesn't shows anything.

If I set delta = 0.1, it already shows.

Does anyone know how do I plot a dataset with a small distance between max and min?

Edit:

$Version

9.0 for Mac OS X x86 (64-bit) (January 24, 2013)

$\endgroup$

2 Answers 2

2
$\begingroup$

Must be a version issue:

$Version

"10.0 for Mac OS X x86 (64-bit) (September 10, 2014)"

SeedRandom[10];
delta = 0.00001;
data = Block[{
    x = RandomReal[],
    y = RandomReal[]},
   Table[{
     x + RandomReal[] delta,
     y + RandomReal[] delta,
     RandomInteger[100]},
    {i, 1, 100}]];

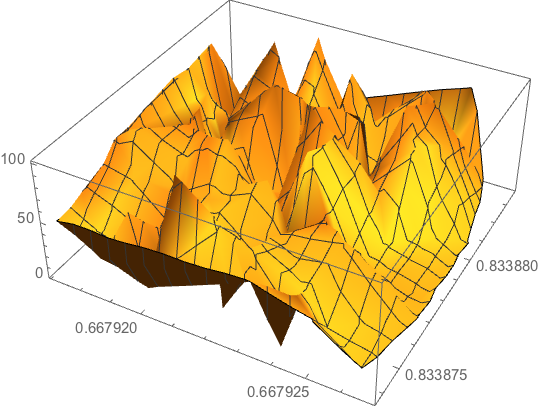
ListPlot3D[data, PlotRange -> All]

enter image description here

$\endgroup$
1
  • $\begingroup$ Indeed, updated the question to reflect that. $\endgroup$ Commented Nov 13, 2014 at 18:07
0
$\begingroup$
ListPlot3D[data, PlotRange -> {Min[data], Max[data]}]
$\endgroup$

Your Answer

By clicking “Post Your Answer”, you agree to our terms of service and acknowledge you have read our privacy policy.

Not the answer you're looking for? Browse other questions tagged or ask your own question.