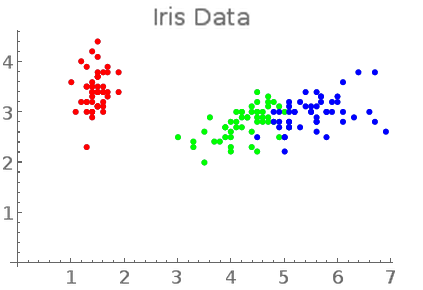
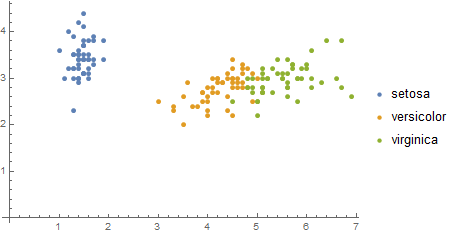
Still learning the new DataSet feature, I would like to create a ListPlot where the color of the points is to be determined by a column in the dataset. Here is what I have:
(* import and set column names *)
iris = SemanticImport["http://aima.cs.berkeley.edu/data/iris.csv"];
iris = iris[All, <|
    "SepalLength" -> 1, "SepalWidth" -> 2,
    "PetalLength" -> 3, "PetalWidth" -> 4, "Species" -> 5
|>]

(* ListPlot *)
iris[ListPlot, {"PetalLength", "SepalWidth"}]
Now I have no idea how to set the color according the "Species" column. The documentation did not help. Ideally, the plot has a legend mapping colors to species.
Any hint appreciated!


