2
$\begingroup$

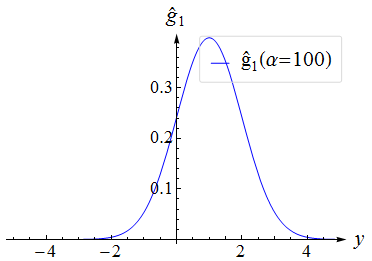
I would like to simply plot a density function $f_1$ and I would like to put a legend but I cannot do it as I wish. The problem is simple but I spent alot of time and couldnt solve it. I will be happy for your help. Thanks in advance. Here is my code:

f1[y_] := (PDF[NormalDistribution[1, 1], y]); 

Plot[{f1[y]}, {y, -5, 5}, PerformanceGoal -> "Quality", PlotLegends -> Placed[LineLegend[{Style[Subscript[OverHat[g], 1] (\[Alpha] = 100), FontSize -> 21]}, LegendFunction -> (Framed[#, RoundingRadius -> 2, FrameStyle -> LightGray] &), BaseStyle -> 18], {Right, Top}], PlotStyle -> {Blue}, PlotRange -> Automatic, AxesLabel -> {Style[y, FontSize -> 21], Style[Subscript[OverHat[g], 1], FontSize -> 21]}, BaseStyle -> 18, AxesStyle -> Arrowheads[0.03]]

The probem is at this point

Style[Subscript[OverHat[g], 1] (\[Alpha] = 100),

First I dont see any $\alpha$ and second the term ([Alpha] = 100) is coming in front of Subscript[OverHat[g], 1], which is annoying me alot.

$\endgroup$

1 Answer 1

3
$\begingroup$
Plot[{f1[y]}, {y, -5, 5}, PerformanceGoal -> "Quality", 
 PlotLegends -> Placed[LineLegend[{Style[
      Row[{Subscript[OverHat[g], 1] , "(\[Alpha]=100)"}], 
      FontSize -> 21]}, 
    LegendFunction -> (Framed[#, RoundingRadius -> 2, 
        FrameStyle -> LightGray] &), BaseStyle -> 18], {Right, Top}], 
 PlotStyle -> {Blue}, PlotRange -> Automatic, 
 AxesLabel -> {Style[y, FontSize -> 21], 
   Style[Subscript[OverHat[g], 1], FontSize -> 21]}, BaseStyle -> 18, 
 AxesStyle -> Arrowheads[0.03]]

enter image description here

You could also use

Style[HoldForm[Subscript[OverHat[g], 1] (\[Alpha] = 100)],  FontSize -> 21]
$\endgroup$
4
  • $\begingroup$ thank you very much for the answer. It solved my problem completely. I wonder one more little thing if you dont mind. If I have say $4$ legend terms and I want to make a $2\times 2$ legend. How can I do it? I mean in the default case it lists $4$ items one under the other one. Thanks. $\endgroup$ Commented Oct 19, 2014 at 22:51
  • $\begingroup$ @SeyhmusGüngören - use the LegendLayout option to LineLegend, eg LineLegend[63, Range[4], LegendLayout -> {"Row", 2}] $\endgroup$
    – Verbeia
    Commented Oct 19, 2014 at 22:54
  • $\begingroup$ @seyhmus, can you add a simple example of the 4 terms to your post? ... I see Verbeia answered your question already. $\endgroup$
    – kglr
    Commented Oct 19, 2014 at 22:55
  • $\begingroup$ @Verbeia thank you very much for pointing out. Very good moderator) $\endgroup$ Commented Oct 19, 2014 at 22:56

Your Answer

By clicking “Post Your Answer”, you agree to our terms of service and acknowledge you have read our privacy policy.

Not the answer you're looking for? Browse other questions tagged or ask your own question.