4
$\begingroup$

I am attempting to implement a spectral clustering routine using Mathematica, but I am encountering difficulties.

Using the standard Gaussian similarity function found in section 2.2 of this paper and setting the parameter $\sigma$ to 1, I have constructed the following code:

SpectralCluster[data_, k_, ε_] := 
   Module[{Similarity, Weight, Walk, LRW, Eigenvals, Eigenvecs, Kvecs},    
      Similarity= With[{tr = Transpose[data]},
         Function[point, Exp[-Sqrt[Total[(point-tr)^2]]/ε]] /@data];
      Weight = DiagonalMatrix[Total /@ Similarity];
      Walk = Inverse[Weight].Similarity;
      LRW = IdentityMatrix[Length[Similarity]] - Walk;
      {Eigenvals, Eigenvecs} = Eigensystem[LRW];
      Kvecs = Take[Eigenvecs, k];
      ClusteringComponents[Kvecs, k, 1, Method ->"KMeans",
         DistanceFunction->SquaredEuclideanDistance]
   ]

To test the algorithm I generate the following data:

x1=RandomVariate[MultinormalDistribution[{2, 0},{{1, 0},{0, 8}}],25];
x2=RandomVariate[MultinormalDistribution[{4, 0},{{1, 0},{0, 8}}],25];
x3=RandomVariate[MultinormalDistribution[{6, 0},{{1, 0},{0, 8}}],25];
x4=RandomVariate[MultinormalDistribution[{8, 0},{{1, 0},{0, 8}}],25];
pts=Join[x1,x2,x3,x4];
ListPlot[pts]
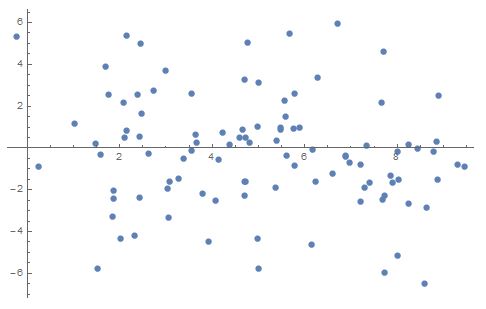
enter image description here

Given the following inputs

SpecCluster = SpectralCluster[pts, 4, 1]
ListPlot[{pts, SpecCluster}]

I obtain the outputs

{1,2,3,4}
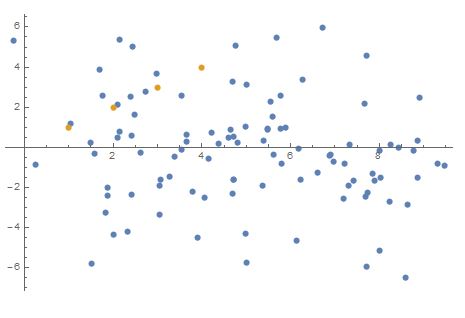
enter image description here

I've run my spectral clustering code on a few different sets of data (not always generated from the Multinormal Distribution) and it always returns a set of increasing integers.

Where am I going wrong?

$\endgroup$

1 Answer 1

12
$\begingroup$

I've spotted three issues with your approach and posted code:

  1. Spectral clustering uses the eigenvectors associated with the $k$ smallest eigenvalues of the Laplacian, but your code is selecting those associated with the $k$ largest eigenvalues.
  2. You need to Transpose your Kvecs prior to passing them to ClusteringComponents. As currently written, you're looking for $k$ clusters in a set of $k$ $N$-component vectors, rather than clustering $N$ $k$-component vectors as desired.
  3. ClusteringComponents returns a list of integers identifying the cluster assignments for the points in the original data set. This is not going to be especially meaningful when plotted alongside your original point set.

To address the first two issues, let us modify your posted code as follows:

SpectralCluster[data_, k_, epsilon_] := 
   Module[{Similarity, Walk, LRW, Kvecs}, 
      Similarity = With[{tr = Transpose[data]}, 
         Function[point, Exp[-Sqrt[Total[(point - tr)^2]]/epsilon]] /@ data];
      Walk = DiagonalMatrix[1/(Total /@ Similarity)].Similarity;
      LRW = IdentityMatrix[Length[Similarity]] - Walk;
      Kvecs = Eigenvectors[LRW, -k];
      ClusteringComponents[Transpose[Kvecs], k, 1, Method -> "KMeans",
         DistanceFunction -> SquaredEuclideanDistance]
  ]

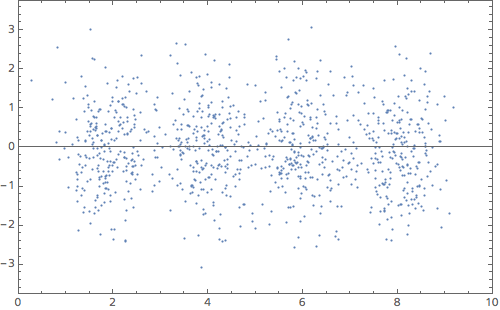
Now, let's test this out on a somewhat larger point set, with slightly better defined clusters:

SeedRandom[12345];
x1 = RandomVariate[MultinormalDistribution[{2, 0}, {{0.25, 0}, {0, 1}}], 250];
x2 = RandomVariate[MultinormalDistribution[{4, 0}, {{0.25, 0}, {0, 1}}], 250];
x3 = RandomVariate[MultinormalDistribution[{6, 0}, {{0.25, 0}, {0, 1}}], 250];
x4 = RandomVariate[MultinormalDistribution[{8, 0}, {{0.25, 0}, {0, 1}}], 250];
pts = Join[x1, x2, x3, x4];

Input point set to spectral clustering routine

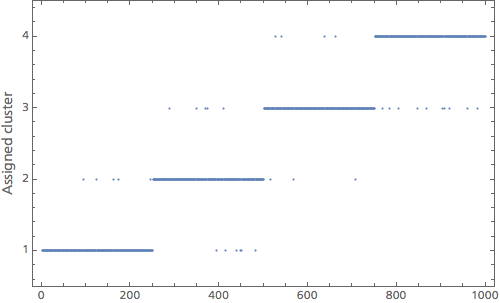
Running the modified routine yields:

clusters = SpectralCluster[pts, 4, 0.25];

which, when plotted, shows the assignments of points to clusters as:

Plot of cluster assignments

As can be seen, the clustering algorithm has done a good job of extracting the four clusters -- a perfect assignment would have had the first 250 points assigned to one cluster, the next 250 assigned to a second, and so on. (The actual cluster labels are ultimately arbitrary here.)

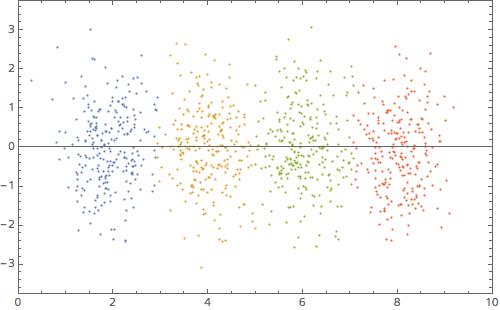
If you'd like to visualize the clusters within the point set itself, you'd need additional code to extract the actual points associated with each cluster. One approach could be:

clusteredPts[i_] := pts[[Flatten[Position[clusters, i]]]];
ListPlot[Table[clusteredPts[i], {i, 1, 4}], 
   Frame -> True, 
   ImageSize -> 500, 
   BaseStyle -> {FontFamily -> "Frutiger Neue LT W1G", FontSize -> 12}, 
   PlotRange -> {{0, 10}, {-3.75, 3.75}}
]

Point set with clusters colour-coded

$\endgroup$
2
  • 1
    $\begingroup$ Looks okay. At first blush, I'd merge two lines myself: Walk = DiagonalMatrix[1/(Total /@ Similarity)].Similarity;. $\endgroup$ Commented May 24, 2015 at 21:29
  • $\begingroup$ @Guesswhoitis. Agreed, answer amended accordingly. I was focussed on correcting logical errors over programming style, but your suggestion is a good refinement. $\endgroup$ Commented May 24, 2015 at 21:39

Your Answer

By clicking “Post Your Answer”, you agree to our terms of service and acknowledge you have read our privacy policy.

Not the answer you're looking for? Browse other questions tagged or ask your own question.