6
$\begingroup$

Here is what I am trying to plot:

randomWalk := NestList[# + RandomReal[{-1, 1}] &, 0, 1000];
Show[Table[ListPlot[randomWalk, Joined -> True], {100}], PlotRange -> Automatic]

Which gives:
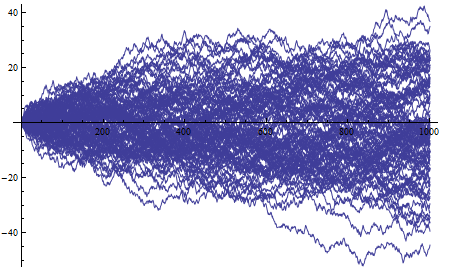
enter image description here

What I'd like to do is give the lines a bit of transparency so that it is clearer to see the density of the plot at various areas; i.e. the darker the area, the more overlapping lines there are at that point. Since this is a ListPlot though, how can you change the properties - i.e. opacity - of the lines?

$\endgroup$
0

1 Answer 1

6
$\begingroup$

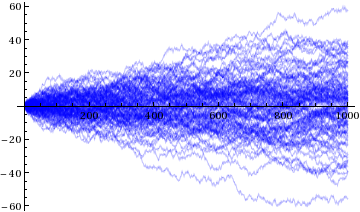
Putting the table inside ListPlot and setting the Opacity as part of the PlotStyle:

ListPlot[
  Table[randomWalk, {100}], 
  PlotStyle -> Directive[Blue, Opacity[0.25]], Joined -> True]

enter image description here

$\endgroup$
3
  • 1
    $\begingroup$ PlotStyle -> Opacity[1/5, Black] also works. $\endgroup$ Commented Apr 30, 2014 at 15:31
  • $\begingroup$ @Alexy - This one will run and run ;) $\endgroup$
    – Ymareth
    Commented Apr 30, 2014 at 15:33
  • $\begingroup$ Brilliant, thank you @Ymareth and Oska $\endgroup$
    – Aron
    Commented Apr 30, 2014 at 16:26

Your Answer

By clicking “Post Your Answer”, you agree to our terms of service and acknowledge you have read our privacy policy.

Not the answer you're looking for? Browse other questions tagged or ask your own question.