6
$\begingroup$

I am wondering why the following fails to cover the surface at points near $k = 0$.

c[z_] := (z + 1) (z - 1) (z + 1 + I);

ContourPlot3D[Abs[c[x + I y]] == k^3, {x, -2.5, 2}, {y, -2, 2}, 
{k, 0, 1.75}, Background -> White, AxesLabel -> {"x", "y", "k"}]

Mathematica graphics

Furthermore, when the left hand side is complex expanded and the equation is rearranged with $2xy+k^3$ on the right, the curve looks significantly different, with one large and one small foot, both touching at zero. Why is that?

$\endgroup$
6
  • $\begingroup$ Could you provide more detail on your rearrangement process? $\endgroup$ Commented Mar 26, 2014 at 21:05
  • 2
    $\begingroup$ It's a sampling issue; you could try increasing PlotPoints or MaxRecursion. But why not apply Plot3D to $|c(x+iy)|^{1/3}$ instead? It'll be much faster, and then you can increase MaxRecursion to like 5 and get a really nice plot very quickly. $\endgroup$
    – user484
    Commented Mar 26, 2014 at 21:45
  • 1
    $\begingroup$ There's a lot of space and not a lot of contours down there. So, while sampling points it is highly unlikely to get points outside and inside the countour near k = 0. And ContourPlot is looking for the switch of sign of lhs-rhs of equation, roughly speaking. $\endgroup$
    – Kuba
    Commented Mar 26, 2014 at 21:45
  • $\begingroup$ @Kuba: You took 4 seconds to write a better explanation of the sampling problem. :) $\endgroup$
    – user484
    Commented Mar 26, 2014 at 21:47
  • $\begingroup$ @Sjoerd, I just captured the results of c[x + y I] and moved 2xy to the RHS. ContourPlot3D[ Abs[-1 - x + x^2 + x^3 - y^2 - 3 x y^2 + I (-1 + x^2 - y + 2 x y + 3 x^2 y - y^2 - y^3)] == 2 x y + k^3, {x, -2.5, 2}, {y, -2, 2}, {k, 0, 1.75}] $\endgroup$
    – Gary
    Commented Mar 26, 2014 at 23:21

1 Answer 1

9
$\begingroup$

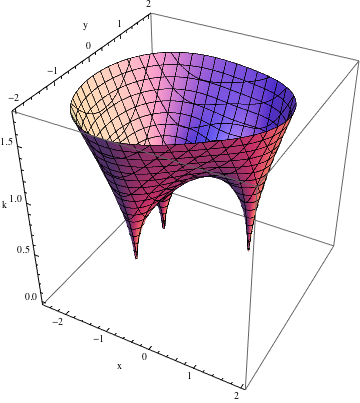
ContourPlot3D is not very good at resolving thin features, because it only knows that the feature exists when one of the sampling points happens to land inside it. In general, one thing you can do is to increase PlotPoints, which improves the plot but takes a very long time.

ContourPlot3D[
 Abs[c[x + I y]] == k^3, {x, -2.5, 2}, {y, -2, 2}, {k, 0, 1.75}, 
 Background -> White, AxesLabel -> {"x", "y", "k"}, PlotPoints -> 20]
enter image description here

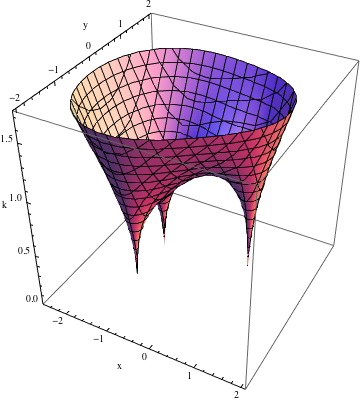
In this particular case, though, your plot is equivalent to $k = |c(x+iy)|^{1/3}$, so you could just use Plot3D instead. This is much faster because it only has to sample the two-dimensional $xy$ plane rather than the three-dimensional $xyk$ space. Then you can afford to make MaxRecursion quite large and it's still really quick to plot.

Plot3D[Abs[c[x + I y]]^(1/3), {x, -2.5, 2}, {y, -2, 2}, PlotRange -> {0, 1.75},
 Background -> White, AxesLabel -> {"x", "y", "k"}, ClippingStyle -> None,
 BoxRatios -> 1, MeshFunctions -> {#1 &, #2 &, #3 &}, MaxRecursion -> 5]
enter image description here

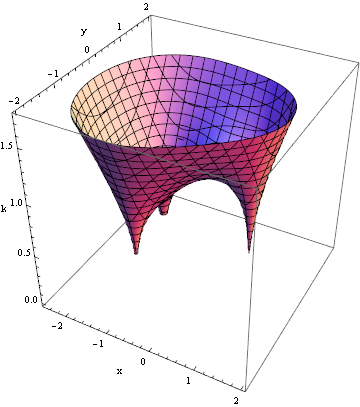
(I've added a few options to make it look like your original plot.)
$\endgroup$
1
  • $\begingroup$ Exceptionally helpful answer. $\endgroup$
    – Gary
    Commented Mar 26, 2014 at 23:30

Your Answer

By clicking “Post Your Answer”, you agree to our terms of service and acknowledge you have read our privacy policy.

Not the answer you're looking for? Browse other questions tagged or ask your own question.