With the command ListPlot[data,Joined -> True] I can visually connect adjacent data points in the array with lines. However, this option appears to be missing in ListPointPlot3D? Is there some manner with which to join with to join (with a line) adjacent three-dimensional points? There will be a large number of points in my data structure, and I'd really like to keep the standard output format of ListPointPlot3D.
3 Answers
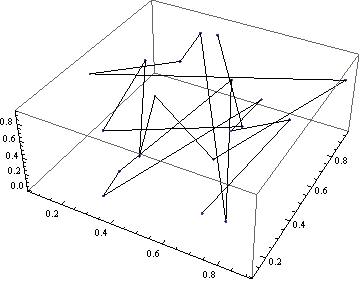
pts = RandomReal[{0, 1}, {19, 3}];
Show[ListPointPlot3D@pts, Graphics3D@Line@pts]

Edit:
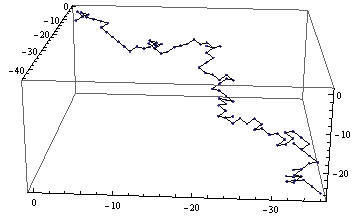
Something slightly more useful as an example:
data = RandomFunction[RandomWalkProcess[0.3], {0, 10^2}, 3];
pts = Transpose@data["States"];
Show[ListPointPlot3D@#, Graphics3D@Line@#] &@pts

-
-
$\begingroup$ Why not
Graphics3D[{Point@pkt, Line@pkt}]? Because ofaxesetc? $\endgroup$– KubaCommented Jan 24, 2014 at 8:09 -
$\begingroup$ @Kuba The OP said "I'd really like to keep the standard output format of ListPointPlot3D", and I think he better way to keep the format of
ListPointPlot3D[]is by using it :) $\endgroup$ Commented Jan 24, 2014 at 11:13 -
One can use ListPointPlot3D and then replace Point with Line. By this way, the plot can enjoy options of ListPointPlot3D:
ListPointPlot3D[...]/. Point[a___] :> {Thick, Line[a]}
-
$\begingroup$ This is great!! I think your answer is better than Dr. belisarius. belisarius's method join points with black lines. However, if there are groups of curve data, your method gives consistent color in each curve, fantastic! $\endgroup$ Commented Apr 1, 2016 at 15:08
I was in the same situation, and what worked really well for me was this answer from a different question.
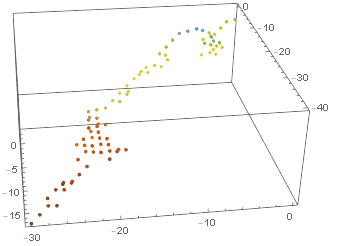
I'll start off with the random data generated by Dr belisarius:
data = RandomFunction[RandomWalkProcess[0.3], {0, 10^2}, 3];
pts = Transpose@data["States"];
ListPointPlot3D[pts, ColorFunction -> "SouthwestColors"]
pts is a list of points {{x1,y1,z1},{x2,y2,z2},...}, we convert this to a list of the form {{t1,{x1,y1,z1}},{t2,{x2,y2,z2}},...}:
ptsT = Transpose[{Range[1, Length@pts], pts}]
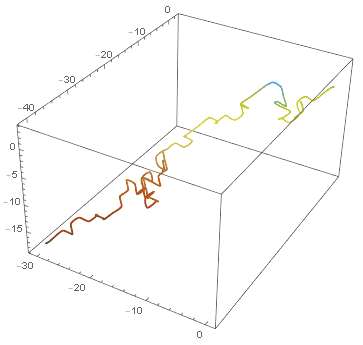
We then create a function to interpolate ptsT, which we can plot using ParametericPlot3D:
func = Interpolation[ptsT];
ParametricPlot3D[func[\[Tau]], {\[Tau], 1, Length@pts},
 ColorFunction ->
  Function[{x, y, z, t}, ColorData["SouthwestColors"][z]]]


ListPlot3D. $\endgroup$