88
$\begingroup$

Under More Information in the help page of ViewMatrix the following entry can be found

With the setting ViewMatrix->Automatic, explicit forms for the matrix m can be found using AbsoluteOptions[g,ViewMatrix].

Trying this with a basic example

gr = Plot3D[Sin[x + y^2], {x, -3, 3}, {y, -2, 2}];
AbsoluteOptions[gr, ViewMatrix]

(* Out[11]= {ViewMatrix -> Automatic} *)

shows, that this does not work as I would have expected it. Even setting ViewMatrix explicitly to Automatic does not help. I tried this on Linux and MacOSX.

Can someone tell me how this is supposed to be used and how I can extract explicit values for the viewing matrix which is used for the projection?

$\endgroup$
1
  • 2
    $\begingroup$ According to the documentation, "With the default setting ViewMatrix->Automatic, the matrices {t,p} are found automatically from the settings for options such as ViewPoint, ViewVertical, and ViewAngle." It may be useful to take examine the code at demonstrations.wolfram.com/UsingViewMatrix to see how the default settings can be used to produce the two needed matrices. $\endgroup$
    – DavidC
    Commented Mar 26, 2012 at 17:57

3 Answers 3

96
$\begingroup$

The documentation is wrong. It should have been fixed, but AbsoluteOptions does not work with ViewMatrix (on all platforms). M- introduced interactive 3D graphics since V6, and after that getting values through AbsoluteOptions (which is an old function) becomes very tricky since the Kernel (who evaluates the option) cannot fully know what is happening on FrontEnd side. To compare, before V6, the Kernel was solely responsible for rendering 3D scene (Postscript!), and of course it could tell every matrix value.

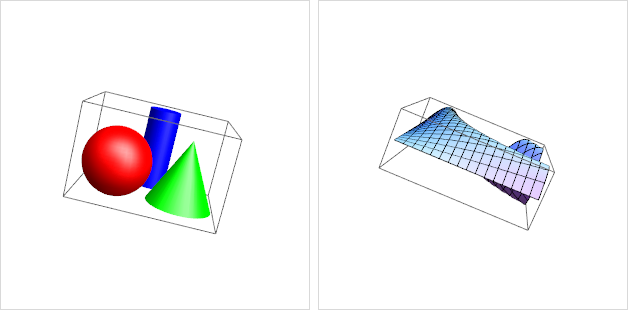
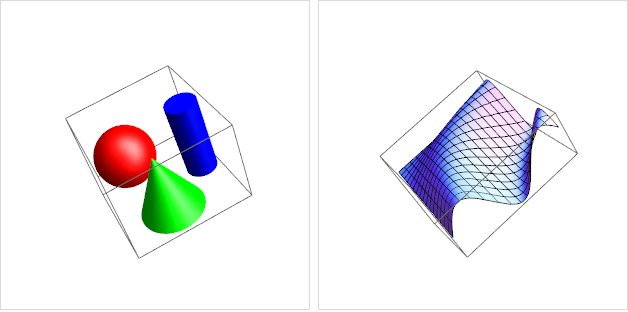
Instead, you can try to use 5 values that can define the matrix using Dynamic: ViewPoint, ViewAngle, ViewVertical, ViewCenter, and ViewRange.

enter image description here

For instance, the following example takes those 5 values from one graphics, and use it for another:

DynamicModule[
 {point = {1.3, -2.4, 2}, angle = N[35 Degree], vertical = {0, 0, 1}, 
  center = Automatic},
 Grid[{{
    Framed[
     Graphics3D[{
       (* Objects *)
       EdgeForm[], Specularity[White, 20],
       FaceForm[Red], Sphere[{-0.2, -0.1, -0.3}, .2],
       FaceForm[Blue], Cylinder[{{0., 0.3, -.5}, {0., 0.3, 0.}}, .1],
       FaceForm[Green], Cone[{{0.2, 0., -0.5}, {0.2, 0., -0.1}}, .2]
       },
      Boxed -> True, Lighting -> "Neutral",
      ImageSize -> 300, RotationAction -> "Clip",

      (* View control *)
      ViewPoint -> Dynamic[point],
      ViewAngle -> Dynamic[angle],
      ViewVertical -> Dynamic[vertical],
      ViewCenter -> Dynamic[center]
      ],
     FrameStyle -> LightGray],

    (* The second object *)
    Framed[
     Plot3D[Sin[x y], {x, 0, 3}, {y, 0, 3},
      ImageSize -> 300, Axes -> False,
      (* View control *)
      ViewPoint -> Dynamic[point],
      ViewAngle -> Dynamic[angle],
      ViewVertical -> Dynamic[vertical],
      ViewCenter -> Dynamic[center]
      ],
     FrameStyle -> LightGray]
    }}]
 ]

Examples: Mathematica graphics

and

Mathematica graphics

This free course explains about the values in vary detail (with some cool demos--OK. shameless self-promotion :) ):

Wolfram Training: Visualization: Advanced 3D Graphics

Also, in essence, you can reconstruct the view matrix and projection matrix out of those values, but I need to take a look at an old textbook to make sure that I am not saying something wrong :)

$\endgroup$
8
  • 15
    $\begingroup$ +1 Very useful diagram and explanation. Much better than the documentation for the individual View settings! $\endgroup$
    – DavidC
    Commented Mar 26, 2012 at 20:23
  • $\begingroup$ +1 for this very illustrative answer, although I already know all this from OpenGL, rendering, and so on. The reason, why I specifically asked how to extract the used projection is, because I want to transform the underly 3d mesh points by myself. For this, I need the used projection for any arbitrary Mathematica Graphics3D. Can we get this from the FE? $\endgroup$
    – halirutan
    Commented Mar 27, 2012 at 12:26
  • $\begingroup$ @Yu-Sung Chang, since this clearly answers my question, I'll accept this. Maybe, I ask a follow-up in another post and I would be grateful when you would look at it too;-) $\endgroup$
    – halirutan
    Commented Mar 27, 2012 at 14:40
  • 13
    $\begingroup$ This image should be part of the documentation. $\endgroup$ Commented May 9, 2012 at 13:20
  • 1
    $\begingroup$ Reminds me of resources.wolframcloud.com/FunctionRepository/resources/… $\endgroup$
    – M.R.
    Commented May 26, 2020 at 23:33
55
+150
$\begingroup$

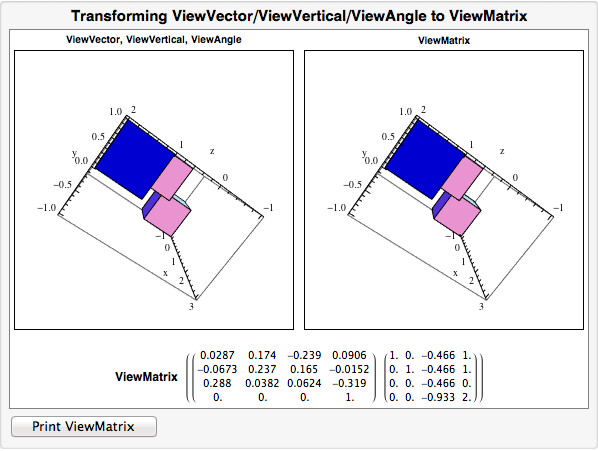
It got a bit out of hand, but here's a way to construct a ViewMatrix pair from the triple ViewVector, ViewAngle, and ViewVertical. The left figure is the Graphics3D object using ViewVector, ViewAngle, and ViewVertical and the right is the one using ViewMatrix. If you rotate the left figure or scale it (by dragging the figure while keeping Alt depressed), the ViewMatrix is updated automatically.

DynamicModule[{tt, pp, bb, gr, center, scale, v1, vv,
  theta, phi, alpha, vert, viewAngle},
 gr = {Cuboid[{-1, -1, -1}, {0, 0, 0}], 
   Cuboid[], {Red, Cuboid[{-1, 0, 0}, {0, 1, 1}]},
   {Blue, Cuboid[{2, 0, 1}, {3, 1, 2}]}};
 bb = PlotRange[Graphics3D[gr]];
 scale = 1/Abs[#1 - #2] & @@@ bb;
 center = Mean /@ bb;
 vv = {{6, 5, 2}, Mean /@ bb};
 v1 = (vv[[1]] - center);
 vert = {0, 0, 1} - {0, 0, 1}.v1 v1;
 viewAngle = 50 Degree;

 theta[v1_] := ArcTan[v1[[3]], Norm[v1[[;; 2]]]];
 phi[v1_] := If[Norm[v1[[;; 2]]] > .0001, ArcTan[v1[[1]], v1[[2]]], 0];
 alpha[vert_, v1_] := ArcTan[{-Sin[phi[v1]], Cos[phi[v1]], 0}.vert, 
   Cross[v1/Norm[v1], {-Sin[phi[v1]], Cos[phi[v1]], 0}].vert];

 tt[v1_, vert_, center_, r_] := TransformationMatrix[
   RotationTransform[-alpha[vert/scale, v1], {0, 0, 1}].
    RotationTransform[-theta[v1], {0, 1, 0}].
    RotationTransform[-phi[v1], {0, 0, 1}].
    ScalingTransform[r {1, 1, 1}].
    TranslationTransform[-center]];

 pp[ang_] := {{1, 0, - Tan[ang], 1}, {0, 1, - Tan[ang ], 1}, {0, 
    0, -Tan[ang ], 0}, {0, 0, -2 Tan[ang] , 2}};

 Panel[Column[{Labeled[#, 
       Style["Transforming ViewVector/ViewVertical/ViewAngle to ViewMatrix", 
       15, FontFamily -> "Helvetica", Bold], 
       Top, Background -> White, Frame -> True, FrameStyle -> Gray] &@
     Grid[{
       {Labeled[Dynamic@
          Graphics3D[{gr}, Axes -> True, AxesLabel -> {"x", "y", "z"},
           ViewAngle -> Dynamic[viewAngle], 
           ViewVector -> Dynamic[vv, (vv = #; center = vv[[2]]; v1 = vv[[1]] - center) &],
           ViewVertical -> Dynamic[vert],
           ImageSize -> 270],
         Style["ViewVector, ViewVertical, ViewAngle", FontFamily -> "Helvetica", Bold], 
         Top, Frame -> True],

        Labeled[Dynamic@Graphics3D[{gr},
            ViewMatrix -> {tt[v1, vert, center, Cot[viewAngle/2]/Norm[v1]], pp[viewAngle/2]}, 
            Axes -> True, AxesLabel -> {"x", "y", "z"}, ImageSize -> 270],
         Style["ViewMatrix", Bold, FontFamily -> "Helvetica"], Top, 
         Frame -> True]},

       {Dynamic@ Labeled[N[{tt[v1, vert, center, Cot[viewAngle/2]/Norm[v1]], 
              pp[viewAngle/2]}] /. {a_?NumericQ :> NumberForm[a, 3]} //
            MatrixForm[#, TableDirections -> Row] &,
          Style["ViewMatrix", 12, FontFamily -> "Helvetica", Bold], Left], SpanFromLeft}},
      Spacings -> {1, 2}],
    Button["Print ViewMatrix",
     Print[N[{tt[v1, vert, center, Cot[viewAngle/2]/Norm[v1]], pp[viewAngle/2]}]],
     ImageSize -> 150]},
   Alignment -> Left]
  ]
 ]
Mathematica graphics

$\endgroup$
1
  • 10
    $\begingroup$ If you ever come back to the site, I just wanted to let you know I've found this answer useful many times now, especially tt. $\endgroup$
    – Michael E2
    Commented Jul 31, 2013 at 22:06
1
$\begingroup$

As of version 13.0, AbsoluteOptions is finally updated, and the mentioned issue no longer exists nowadays:

gr = Plot3D[Sin[x + y^2], {x, -3, 3}, {y, -2, 2}];
AbsoluteOptions[gr, ViewMatrix]
(* {ViewMatrix -> {{{0.140687, 0.114308, 0., 0.}, 
                    {-0.0450415, 0.12473, 0.154878, 4.53058*10^-6}, 
                    {-0.0614696, 0.170224, -0.113486, 3.38378}, 
                    {0., 0., 0., 1.}}, 
                   {{2.96386, 0., 0.5, 0.}, 
                    {0., 2.96386, 0.5, 0.}, 
                    {0., 0., 3.04444, -8.27738}, 
                    {0., 0., 1., 0.}}}} *)
$\endgroup$

Your Answer

By clicking “Post Your Answer”, you agree to our terms of service and acknowledge you have read our privacy policy.

Not the answer you're looking for? Browse other questions tagged or ask your own question.