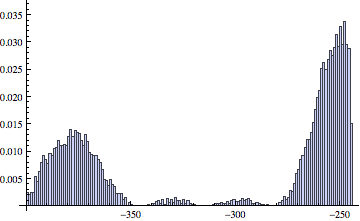
I've declared my own probability distribution as follows
dist[a_, b_] := ProbabilityDistribution[Cos[(b x)/2]^2 Sinc[a x]^2, {x, -400, 400}];
When I try to create a random variate using this probability distribution I only get data points in a range (-400, -245).
data = RandomVariate[dist[200, 500], 10^4];
Histogram[data, 200, "ProbabilityDensity"]

Just to clarify, this isn't an issue with the histogram, when I look at data it does only contain numbers in the range seen above.

RandomVariatecall. $\endgroup$Das your distribution name, that is a built-in symbol. As a general rule it is always good to start your own function names in lower case to avoid such conflicts. $\endgroup$D, I'm using the curly D that I could not get on this page, I'll edit again to save confusion! $\endgroup$