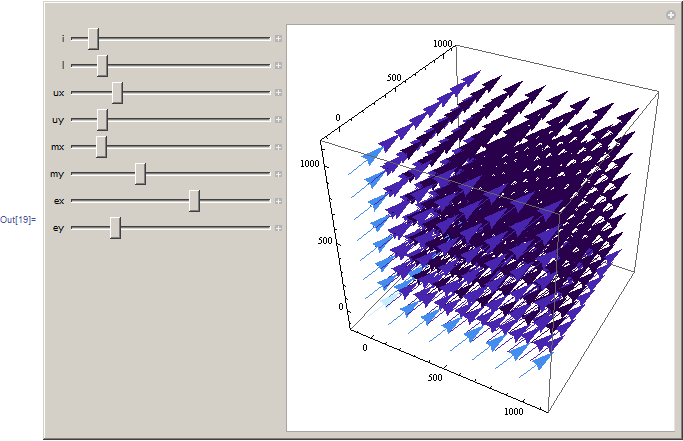
My aim is to plot a vector field of the following system with a few trajectories:
$$r'(t)=i-l.r(t)-\text{ux}. r(t). x(t)-\text{uy}. r(t). y(t) \\ x'(t)=\text{ex}. \text{ux}. r(t). x(t)-\text{mx}. x(t)\\y'(t)=\text{ey}.\text{uy}. r(t). y(t)-\text{my}. y(t)$$
$i,l,ux,uy,mx,my,ex,ey$ are parameters.
Here is what I have managed to do so far:
Manipulate[
  ParametricPlot3D[
    Evaluate[
      {r[t], x[t], y[t]} /.
        NDSolve[{
          r'[t] == i - l*r[t] - ux*r[t]*x[t] - uy*r[t]*y[t],
          x'[t] == -mx*x[t] + ex*ux*r[t]*x[t],
          y'[t] == -my*y[t] + ey*uy*r[t]*y[t],
          r[0] == 1, x[0] == 1, y[0] == 1},
          {r, x, y}, {t, 0, 100000},
          MaxSteps -> Infinity,
          AccuracyGoal -> 10]],
    {t, 0, 10000},
    PlotRange -> Full,
    AxesLabel -> {"r(t)", "x(t)", "y(t)"},
    PlotStyle -> {Green, Thickness[0.01]}],
  {i, 0, 100},
  {l, 0, 1},
  {ux, 0, 1},
  {uy, 0, 1},
  {mx, 0, 1},
  {my, 0, 1},
  {ex, 0, 1},
  {ey, 0, 1}]
This plot one trajectory and it works fine (although you might not think so looking at it but it is due to the equations.
Then when I tried to plot the vector field alone and I got stuck.I do not know what is going wrong:
Manipulate[
  VectorPlot3D[
    Evaluate[
      {r[t], x[t], y[t]} /.
        NDSolve[{
          r'[t] == i - l*r[t] - ux*r[t]*x[t] - uy*r[t]*y[t],
          x'[t] == -mx*x[t] + ex*ux*r[t]*x[t],
          y'[t] == -my*y[t] + ey*uy*r[t]*y[t],
          r[0] == 1, x[0] == 1, y[0] == 1},
          {r, x, y}, {t, 0, 100000},
          MaxSteps -> Infinity,
          AccuracyGoal -> 10]],
    {r[t], 0, 100}, {x[t], 0, 100}, {y[t], 0, 100},
    VectorColorFunction -> "DeepSeaColors"],
  {i, 0, 100},
  {l, 0, 1},
  {ux, 0, 1},
  {uy, 0, 1},
  {mx, 0, 1},
  {my, 0, 1},
  {ex, 0, 1},
  {ey, 0, 1}]
The next thing to do was to plot both the vector field and trajectories on the same plot, I have not tried as I could manage to plot the vector field, so if you can give me any piece of advice about this too, I would be extremely grateul. For 2D, without using Manipulate, I used Show but I guess it will not work if I use Manipulate as I need to make the parameters vary simultaneously for the vector field and the trajectories.
(Do not expect any fancy trajectories with these equations, you can change them to have nicer things, I just would like the general way how plotting this for any system of three equations).
EDIT:
THE TWO ANSWERS BELOW GIVE DIFFERENT THINGS SO I DO NOT KNOW WHAT TO DO.


