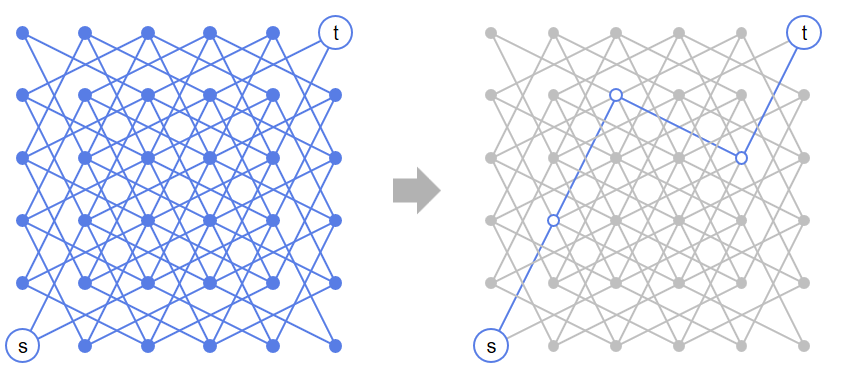
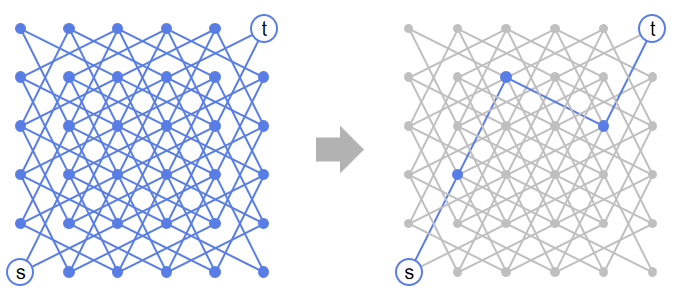
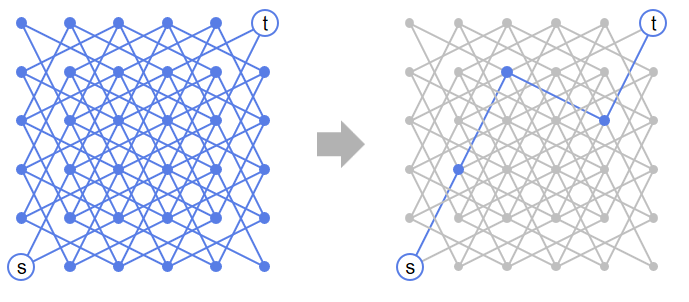
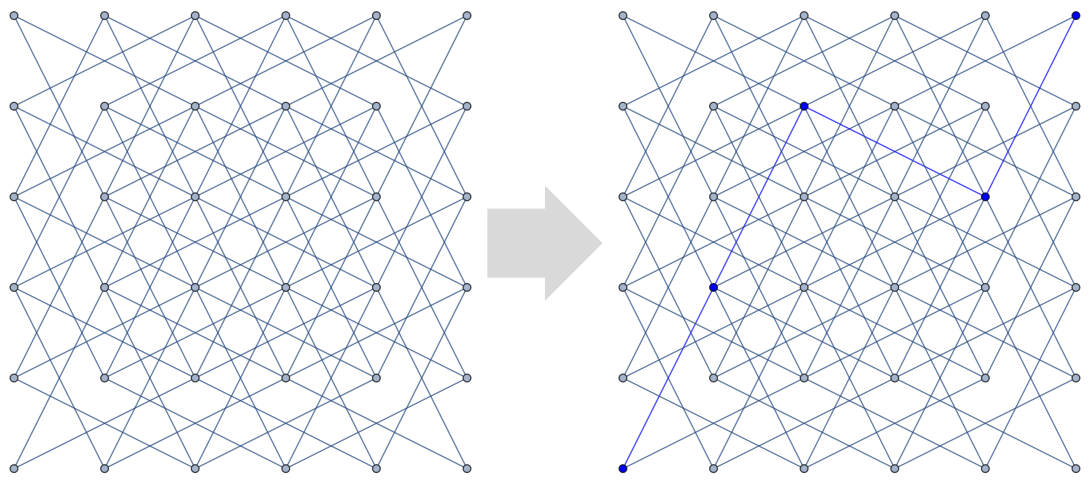
how to create a program that produces a screenshot-like effect?
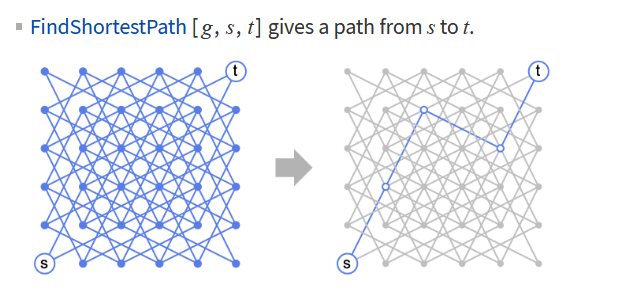
2 Answers
$\begingroup$
$\endgroup$
2
- As @Szabolcs have mention, the graph is
KnightTourGraph.
Clear["Global`*"];
g1 = KnightTourGraph[6, 6, PlotTheme -> "Minimal",
   VertexLabels -> {36 -> Placed["t", Center],
     1 -> Placed["s", Center]}, VertexSize -> {36 -> 0.26, 1 -> 0.26},
    VertexStyle -> {1 -> White, 36 -> White}];
indexes = FindShortestPath[g1, 1, 36]
g2 = HighlightGraph[g1, PathGraph[indexes],
   FormatType -> TraditionalForm, PlotTheme -> "Minimal",
   VertexLabels -> {36 -> Placed["t", Center],
     1 -> Placed["s", Center]}, VertexSize -> {36 -> 0.26, 1 -> 0.26},
    VertexStyle -> Thread[indexes -> White]];
g = Graphics[{GrayLevel[0.7],
    Polygon[{{0, 0}, {-0.5, 0.5}, {-0.5, 0.25}, {-1,
       0.25}, {-1, -0.25}, {-0.5, -0.25}, {-0.5, -0.5}}]},
   ContentSelectable -> False, ImageSize -> 25];
Grid[{{g1, g, g2}}, ItemSize -> {Automatic, Automatic},
 Spacings -> {{0, 1.25, 1}, Inherited}]
Edit
- Construct the graph directly. For the two point
{x1,y1}and{x2,y2}, if they are the two points of the rectangle which two sides lengths are2and1,then such two points join anUndirectedEdge.
Clear["Global`*"];
pts = Tuples[{Range[6], Range[6]}];
pairs = DeleteDuplicates[{{x1, y1}, {x2, y2}} /.
    Solve[{(Abs[x2 - x1] == 2 && Abs[y2 - y1] == 1 ||
         Abs[x2 - x1] == 1 && Abs[y2 - y1] == 2) &&
       1 <= {x1, y1, x2, y2} <= 6}, {x1, y1, x2, y2}, Integers],
   Reverse[#1] == #2 &];
g1 = Graph[pts, UndirectedEdge @@@ pairs,
   VertexCoordinates -> pts, {FormatType -> TraditionalForm,
    GraphLayout -> {"Dimension" -> 2, "PackingLayout" -> None,
      "VertexLayout" -> {"GridEmbedding", "Dimension" -> {6, 6}}},
    ImageSize -> 140, PlotTheme -> "Minimal",
    VertexLabels -> {{6, 6} -> Placed["t", Center], {1, 1} ->
       Placed["s", Center]},
    VertexSize -> {{6, 6} -> 0.26, {1, 1} -> 0.26},
    VertexStyle -> {{1, 1} -> GrayLevel[1], {6, 6} ->
       GrayLevel[1]}}];
indexes = FindShortestPath[g1, {1, 1}, {6, 6}];
g2 = HighlightGraph[g1, PathGraph[indexes]];
g = Graphics[{GrayLevel[0.7],
    Polygon[{{0, 0}, {-0.5, 0.5}, {-0.5, 0.25}, {-1,
       0.25}, {-1, -0.25}, {-0.5, -0.25}, {-0.5, -0.5}}]},
   ContentSelectable -> False, ImageSize -> 25];
Grid[{{g1, g, g2}}, ItemSize -> {Automatic, Automatic},
 Spacings -> {{0, 1.25, 1}, Inherited}]
Original
- Select and copy the code from the document https://reference.wolfram.com/language/ref/FindShortestPath.html
and use
FullFormto see the details of the code.
g1=Graph[{1, 2, 3, 4, 5, 6, 7, 8, 9, 10, 11, 12, 13, 14, 15, 16, 17, 18, 19, 20, 21, 22, 23, 24, 25, 26, 27, 28, 29,
  30, 31, 32, 33, 34, 35, 36}, {UndirectedEdge[1, 9], UndirectedEdge[1, 14], UndirectedEdge[2, 10],
  UndirectedEdge[2, 13], UndirectedEdge[2, 15], UndirectedEdge[3, 7], UndirectedEdge[3, 11], UndirectedEdge[3, 14],
  UndirectedEdge[3, 16], UndirectedEdge[4, 8], UndirectedEdge[4, 12], UndirectedEdge[4, 15], UndirectedEdge[4, 17],
  UndirectedEdge[5, 9], UndirectedEdge[5, 16], UndirectedEdge[5, 18], UndirectedEdge[6, 10], UndirectedEdge[6, 17],
  UndirectedEdge[7, 15], UndirectedEdge[7, 20], UndirectedEdge[8, 16], UndirectedEdge[8, 19], UndirectedEdge[8, 21],
  UndirectedEdge[9, 13], UndirectedEdge[9, 17], UndirectedEdge[9, 20], UndirectedEdge[9, 22],
  UndirectedEdge[10, 14], UndirectedEdge[10, 18], UndirectedEdge[10, 21], UndirectedEdge[10, 23],
  UndirectedEdge[11, 15], UndirectedEdge[11, 22], UndirectedEdge[11, 24], UndirectedEdge[12, 16],
  UndirectedEdge[12, 23], UndirectedEdge[13, 21], UndirectedEdge[13, 26], UndirectedEdge[14, 22],
  UndirectedEdge[14, 25], UndirectedEdge[14, 27], UndirectedEdge[15, 19], UndirectedEdge[15, 23],
  UndirectedEdge[15, 26], UndirectedEdge[15, 28], UndirectedEdge[16, 20], UndirectedEdge[16, 24],
  UndirectedEdge[16, 27], UndirectedEdge[16, 29], UndirectedEdge[17, 21], UndirectedEdge[17, 28],
  UndirectedEdge[17, 30], UndirectedEdge[18, 22], UndirectedEdge[18, 29], UndirectedEdge[19, 27],
  UndirectedEdge[19, 32], UndirectedEdge[20, 28], UndirectedEdge[20, 31], UndirectedEdge[20, 33],
  UndirectedEdge[21, 25], UndirectedEdge[21, 29], UndirectedEdge[21, 32], UndirectedEdge[21, 34],
  UndirectedEdge[22, 26], UndirectedEdge[22, 30], UndirectedEdge[22, 33], UndirectedEdge[22, 35],
  UndirectedEdge[23, 27], UndirectedEdge[23, 34], UndirectedEdge[23, 36], UndirectedEdge[24, 28],
  UndirectedEdge[24, 35], UndirectedEdge[25, 33], UndirectedEdge[26, 34], UndirectedEdge[27, 31],
  UndirectedEdge[27, 35], UndirectedEdge[28, 32], UndirectedEdge[28, 36], UndirectedEdge[29, 33],
  UndirectedEdge[30, 34]}, {FormatType -> TraditionalForm,
  GraphLayout -> {"Dimension" -> 2, "PackingLayout" -> None,
    "VertexLayout" -> {"GridEmbedding", "Dimension" -> {6, 6}}}, ImageSize -> 140, PlotTheme -> "Minimal",
  VertexLabels -> {36 -> Placed["t", Center], 1 -> Placed["s", Center]}, VertexSize -> {36 -> 0.26, 1 -> 0.26},
  VertexStyle -> {1 -> GrayLevel[1], 36 -> GrayLevel[1]}}]
- Then use
FindShortestPath.
indexes = FindShortestPath[g1, 1, 36];
g2 = HighlightGraph[g1, PathGraph[indexes]];
g = Graphics[{GrayLevel[0.7],
    Polygon[{{0, 0}, {-0.5, 0.5}, {-0.5, 0.25}, {-1,
       0.25}, {-1, -0.25}, {-0.5, -0.25}, {-0.5, -0.5}}]},
   ContentSelectable -> False, ImageSize -> 25];
Grid[{{g1, g, g2}}, ItemSize -> {Automatic, Automatic},
 Spacings -> {{0, 1.25, 1}, Inherited}]
-
$\begingroup$ how to generate abitary nice grids? not manual add... $\endgroup$– ABCDEMMMCommented Jun 3 at 3:24
-
1
$\begingroup$
$\endgroup$
0
vlist = Tuples[Range[6], 2];

relation = Sort@Abs[# - #2] == {1, 2} &;

g0 = RelationGraph[relation, vlist,
      VertexCoordinates -> vlist, ImageSize -> Medium];

g1 = HighlightGraph[g0,
   Style[PathGraph @ FindShortestPath[g0, {1, 1}, {6, 6}], Blue]];

arrow = Graphics @
 {LightGray,
  Rotate[
   ChartElementData["ArrowRectangle", "ArrowheadAngle" -> 90][{{0, 1}, {0, 1}}],
   - 90  Degree]};

Row[{g0, g1}, arrow]

