2
$\begingroup$

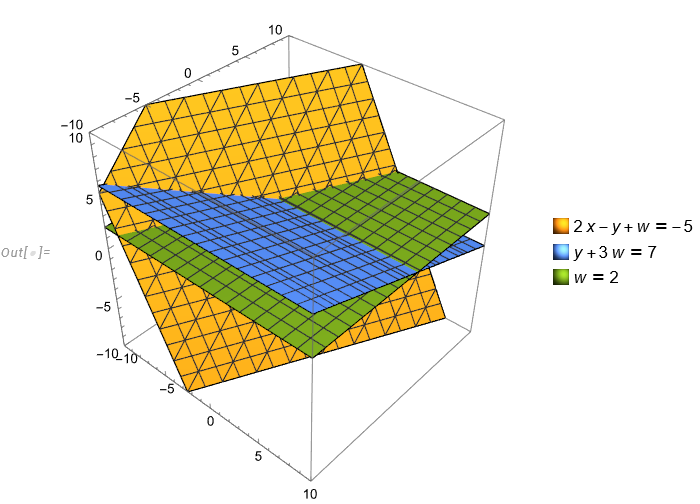
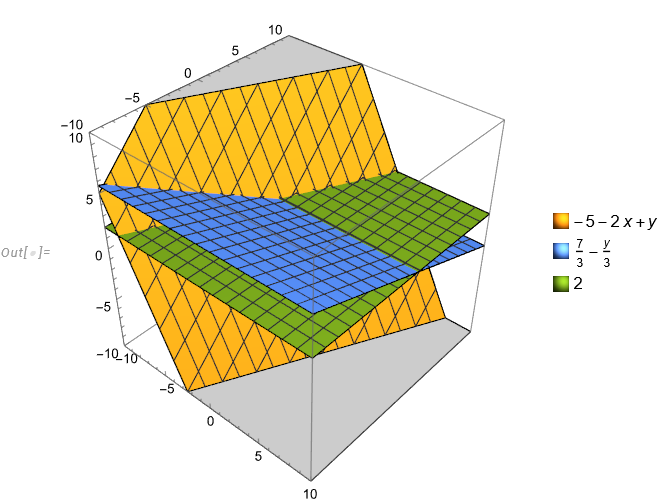
I am trying to plot the following linear system ($3\times 3$) in different ways. My question is what wrong have I done to my last code?

eq1 = 2 x - y + w == -5;
eq2 = y + 3*w == 7;
eq3 = w == 2;

(*Use ContourPlot3D to visualize*)
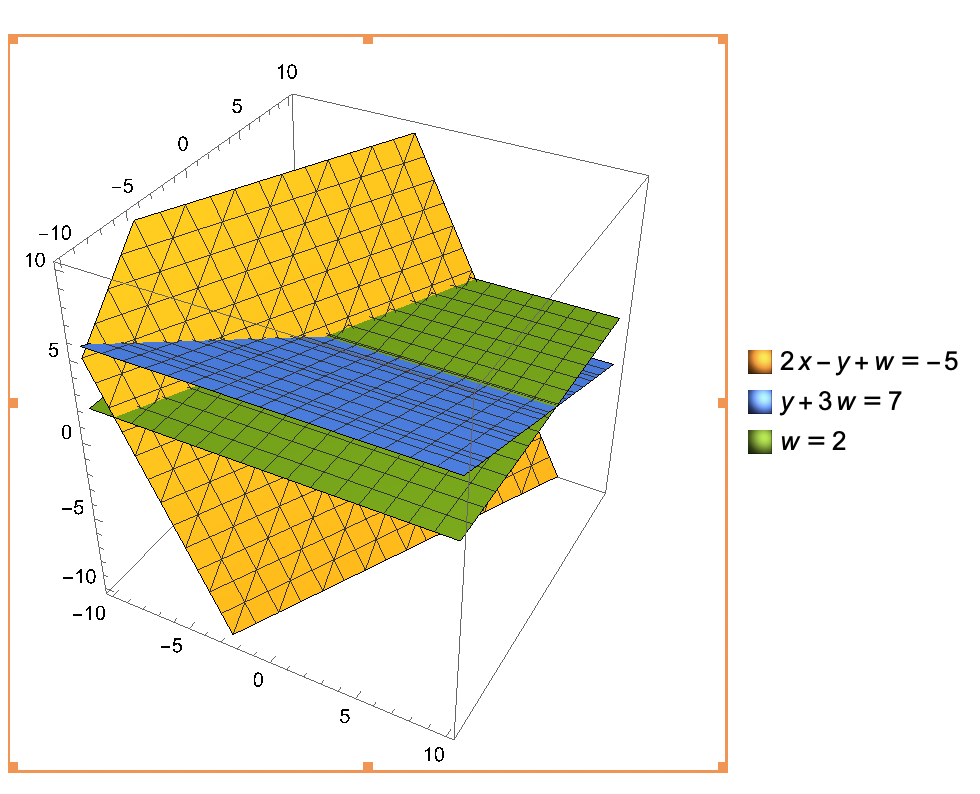
ContourPlot3D[{2 x - y + w == -5, y + 3*w == 7, w == 2}, {x, -10, 
  10}, {y, -10, 10}, {w, -10, 10}, PlotLegends -> "Expressions"]

enter image description here

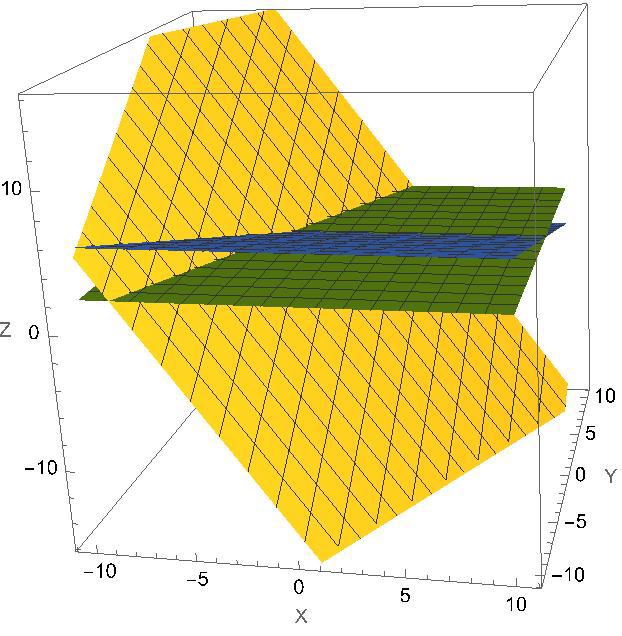
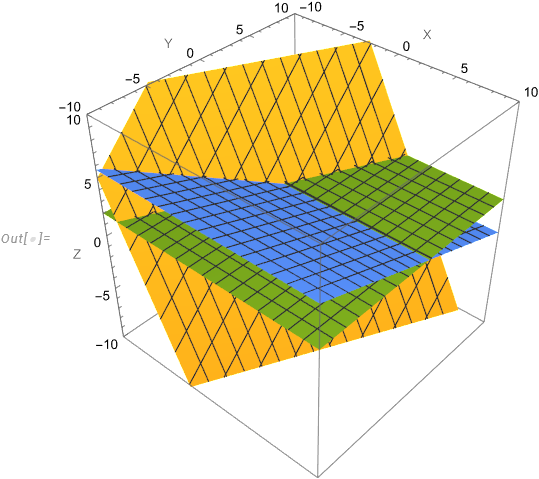
ParametricPlot3D[{{x, y, -5 - 2 x + y}, {x, y, (7 - y)/3}, {x, y, 
   2}}, {x, -10, 10}, {y, -10, 10}, AxesLabel -> {"X", "Y", "Z"}, 
 BoxRatios -> {1, 1, 1}]

enter image description here

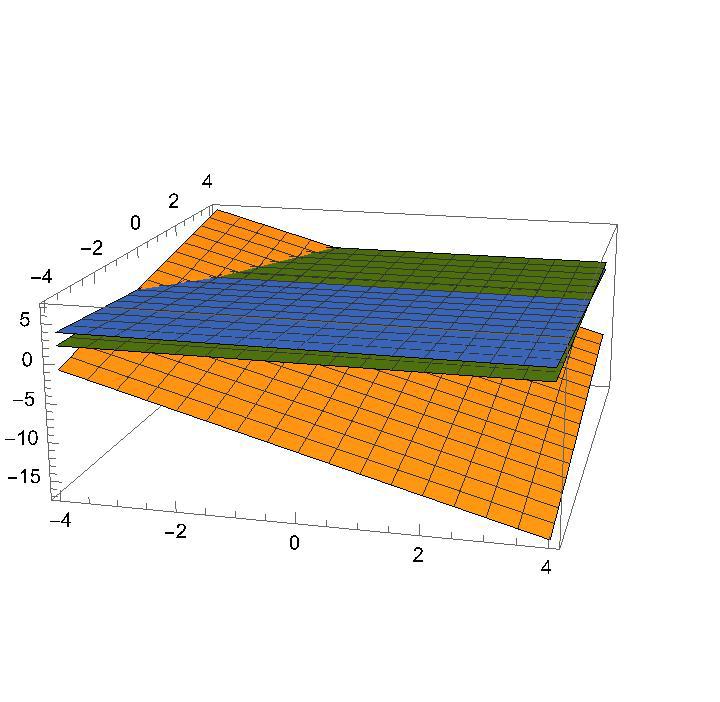
Plot3D[{-5 - 2 x + y, (7/3) - (1/3) y, 2}, {x, -4, 4}, {y, -4, 4}, 
 PlotLegends -> "
Expressions"]

enter image description here

$\endgroup$

2 Answers 2

3
$\begingroup$

Just due to display/plot/scaling difference. This gets to look almost the same by playing with plot range and Mesh options.

eq1 = 2  x - y + w == -5;
eq2 = y + 3*w == 7;
eq3 = w == 2;
eqs = {eq1, eq2, eq3}

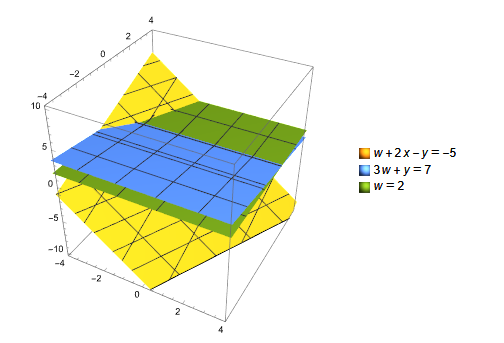
ContourPlot3D[eqs, {x, -10, 10}, {y, -10, 10}, {w, -10, 10}, 
 PlotLegends -> "Expressions", BoxRatios -> {1, 1, 1}, 
 PlotRange -> {{-4, 4}, {-4, 4}, Automatic}, Mesh -> 10]


ParametricPlot3D[{{x, y, -5 - 2  x + y}, {x, y, (7 - y)/3}, {x, y, 
   2}}, {x, -10, 10}, {y, -10, 10}, AxesLabel -> {"X", "Y", "Z"}, 
 BoxRatios -> {1, 1, 1}, PlotRange -> {{-4, 4}, {-4, 4}, Automatic}, 
 Mesh -> 20]

Plot3D[{-5 - 2  x + y, (7/3) - (1/3)  y, 2}, {x, -4, 4}, {y, -4, 4}, 
 PlotLegends -> "Expressions", BoxRatios -> {1, 1, 1}, 
 PlotRange -> {{-4, 4}, {-4, 4}, Automatic}, Mesh -> 8]

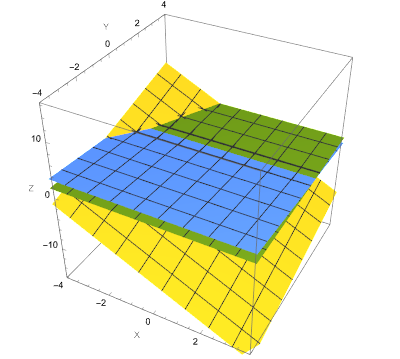
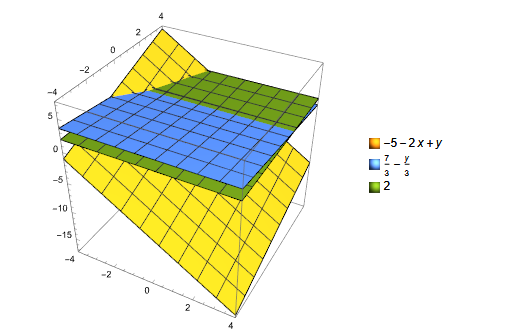
enter image description here

enter image description here

enter image description here

There might be other options to tweak. The point is, it is just a view/display issue. Each command uses has its own settings how to display the 3D final image.

$\endgroup$
1
2
$\begingroup$

There is nothing wrong with your code as far as I can tell.

You may think there is something wrong because the outputs look different.

I believe this is because the orientation and scale of the three plots are not the same.

Make the scale and orientation the same and they look essentially identical. Do this by setting the PlotRange, BoxRatio and ViewPort the same.

v = Options[Plot3D, ViewPoint][[1, 2]]

ContourPlot3D[
 {
  2  x - y + w == -5,
  y + 3*w == 7,
  w == 2
  },
 {x, -10, 10},
 {y, -10, 10},
 {w, -10, 10},
 PlotLegends -> "Expressions",
 BoxRatios -> {1, 1, 1},
 ViewPoint -> v,
 PlotRange -> {{-10, 10}, {-10, 10}, {-10, 10}}
 ]

enter image description here

ParametricPlot3D[
 {
  {x, y, -5 - 2  x + y},
  {x, y, (7 - y)/3},
  {x, y, 2}
  },
 {x, -10, 10},
 {y, -10, 10},
 AxesLabel -> {"X", "Y", "Z"},
 BoxRatios -> {1, 1, 1},
 ViewPoint -> v,
 PlotRange -> {{-10, 10}, {-10, 10}, {-10, 10}}
 ]

enter image description here

Plot3D[
 {
  -5 - 2  x + y,
  (7/3) - (1/3)  y,
  2
  },
 {x, -10, 10},
 {y, -10, 10},
 PlotLegends -> "Expressions",
 ViewPoint -> Dynamic[v],
 PlotRange -> {{-10, 10}, {-10, 10}, {-10, 10}},
 BoxRatios -> {1, 1, 1}
 ]

enter image description here

$\endgroup$

Your Answer

By clicking “Post Your Answer”, you agree to our terms of service and acknowledge you have read our privacy policy.

Not the answer you're looking for? Browse other questions tagged or ask your own question.