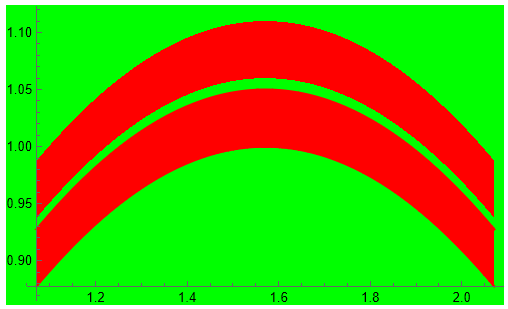
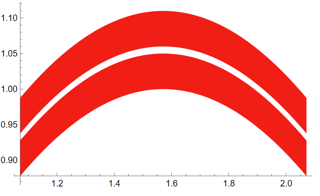
They seem to forget add antialiasing on Filling.
When style is transparent we can see a rough boundary.
When style is not transparent the boundary is overlaid with the curve of plotting function on which the antialiasing is used, so no rough boundary is visible.
Is this the same with newer versions of Mathematica?
$Version
Plot[{Sin[x], Sin[x] + 0.05, Sin[x] + 0.06,
  Sin[x] + 0.11}, {x, Pi/2 - 0.5, Pi/2 + 0.5},
 Filling -> {1 -> {{2}, Red}, 3 -> {{4}, Red}},
 PlotStyle -> {Red, Red, Transparent, Transparent},
 Background -> Green]
"13.0.1 for Microsoft Windows (64-bit) (January 28, 2022)"


Backgroundand increasedPlotPoints$\endgroup$