8
$\begingroup$

I would like to understand how can I plot Arnold tongues (see figure below) with help of Wolfram Mathematica.

enter image description here

From this question, I have borrowed the function that computes the winding number of the circle map. My own version (in order to be consistent with the figure presented above) is

WindingNumber = 
  Compile[{n, η, ϵ, ϕ0}, (Nest[# + η + ϵ*Sin[#] &, ϕ0, n] - ϕ0)/(2*Pi*n)];

Here, η is the parameter, ϕ0 is the initial value and ϵ is the parameter, too. I know that each Arnold tongue corresponds to the rational value of WindingNumber. So, my idea is to check that for a given values of ϵ and η is rational or not. To do it, I need the Wolfram Mathematica analog of RationalQ function (see discussion here). As I understand, there is no analog of RationalQ function, but in this question, I see the naive realization:

TrueQ@Element[x, Rationals]

where (as I understand) one checks that x belongs to Rationals (or not). So, I have tried to create a grid of parameters η and ϵ with help of Table. For each point of the grid, I check is WindingNumber rational or not with the help of the function written above. If true, I mark this point by 1, if false, I mark by 0, so I write

ArnoldTongues = Table[{ϵ, 2*Pi*i, 
    If[TrueQ@Element[WindingNumber [100, 2*Pi*i, 1.0, 0], Rationals], 1, 
     0]}, {i, 0, 1, 0.01}, {ϵ, 0, 1, 0.01}];

As a result, I have the array that is suitable for ListDensityPlot.

However, I obtain that the winding number is always irrational for every point on my grid, which is impossible. What am I doing wrong?

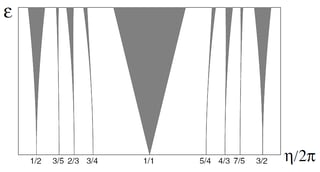
$\endgroup$
6
  • $\begingroup$ @ChrisK , I have updated the question, now everything seems consistent $\endgroup$ Commented Aug 23, 2023 at 19:05
  • 1
    $\begingroup$ Your function WindingNumber only returns real numbers. Mathematica does not consider any real number to be rational. Only explicit ratios of integers are considered rational. Compare TrueQ@Element[0.25, Rationals] with TrueQ@Element[1/4, Rationals] $\endgroup$
    – Bob Hanlon
    Commented Aug 23, 2023 at 19:53
  • $\begingroup$ @BobHanlon , okey, I can try Rationalize. But it seems useless. Does any other approach to visualize Arnold tongues in Wolfram Mathematica exist? $\endgroup$ Commented Aug 23, 2023 at 20:51
  • $\begingroup$ You can just Cases[wnums, wnum_ ;/ Abs[wnum - ratonal] < tol] for each rational you want and some tol, e.g. 1E-4 $\endgroup$
    – I.M.
    Commented Aug 24, 2023 at 2:56
  • $\begingroup$ @I.M. , so, first I generate list of wnums and compare each element with a given rational with the predefined tolereance tol? Does it mean that I have to generate list of rationals, too? $\endgroup$ Commented Aug 24, 2023 at 7:17

1 Answer 1

11
$\begingroup$
(* Set compitation target, use "WVM" if no C compiler is avaliable *)
ClearAll[target] ;
target = "C" ;
ClearAll[windingNumber];
windingNumber = Compile[
    {{n,_Integer},{eta,_Real},{epsilon,_Real},{phi,_Real}},
    (Nest[# + eta + epsilon*Sin[#] &, phi, n] - phi)/(2*Pi*n),
    RuntimeAttributes -> {Listable},
    Parallelization -> True,
    CompilationTarget -> target,
    RuntimeOptions -> "Speed"
];

Generate wnums on a rectangular eta-epsilon grid:

(* Set number of iterations and grid size *)
n = 10^3;
m = 5*10^3;

(* Generate grid *)
eta = 2*Pi*Subdivide[0.0, 1.0, m - 1] ;
epsilon = Subdivide[0.0, 1.0, m - 1] ;

(* Set initial condition *)
phi = 0.0 ;

(* Compute winding numbers *)
wnums = Reverse[Table[windingNumber[n, eta, eps, phi], {eps, epsilon}]] ;

Plot all values:

(* Plot all winding numbers *)
ArrayPlot[wnums, DataRange -> {MinMax[eta], MinMax[epsilon]}, FrameTicks -> {{True, None}, {True, None}}, ImageSize -> 900, AspectRatio -> 1/4, PlotRangePadding -> None]

enter image description here

Filter and plot tongues:

(* Select close to a rational with a given tolerance *)
tol = 10.^-3;
rationals = {0, 1/5, 1/4, 1/3, 1/2, 2/3, 3/4, 4/5, 1} ;
ClearAll[select] ;
select[tol_, list_, rational_] := N[UnitStep[Clip[Abs[list - rational], {0.0, tol}, {-1.0, -1.0}]]] ; 
tongues = Fold[Plus, Map[select[tol, wnums, #] &, rationals]] ;
ArrayPlot[tongues, DataRange -> {MinMax[eta], MinMax[epsilon]}, FrameTicks -> {{True, None}, {True, None}}, ImageSize -> 900, AspectRatio -> 1/4, PlotRangePadding -> None]

enter image description here

$\endgroup$
1
  • $\begingroup$ Beautiful. Thank you so much for this answer $\endgroup$ Commented Aug 26, 2023 at 7:34

Your Answer

By clicking “Post Your Answer”, you agree to our terms of service and acknowledge you have read our privacy policy.

Not the answer you're looking for? Browse other questions tagged or ask your own question.