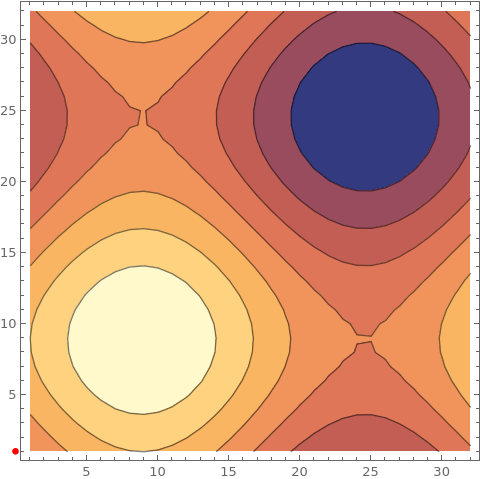
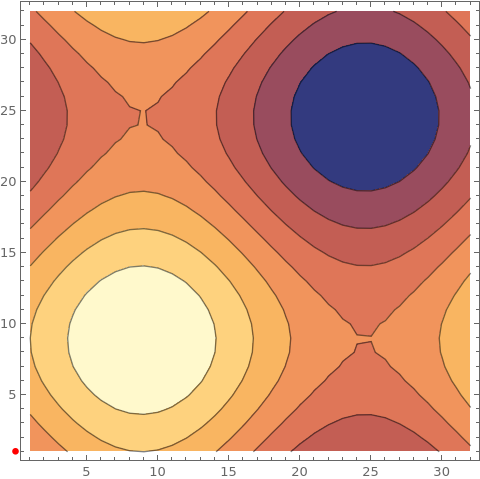
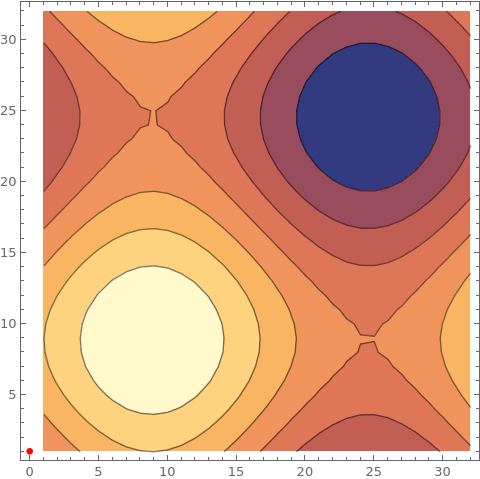
I would like to put a large round dot at (x,y)=(0,1) in front of a plot constructed with the ListContourPlot function. I have made some attempts, but it proved to be unsuccessful. This is one of them, which shows the dot, but does not exhbit the axes:
data = Table[Sin[x] + Sin[y], {x, 0, 2 Pi, 0.2}, {y, 0, 2 Pi, 0.2}];
foregroundData = {{0, 1}};
plot = ListContourPlot[data];
foregroundPlot =
  Graphics[{PointSize[Large], Red, Point[foregroundData]}];
Show[foregroundPlot, plot]
Could you please help me how to show both the axes and the dot?


