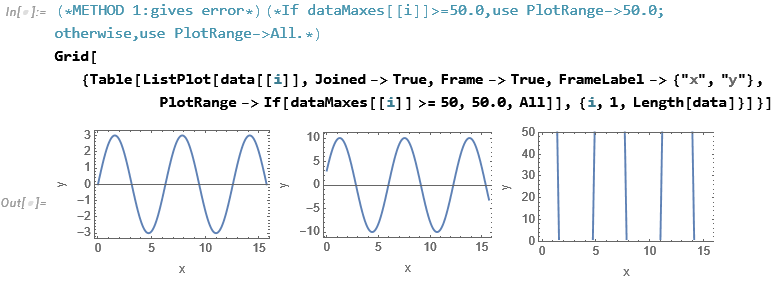
I have several sets of data, and each set of data has a different scale (i.e., a different range of function values). I wish to plot each data set separately. I can do this using Table, ListPlot, and Grid:
(* Generate sample data for the purpose of this minimal working example. *)
xVals = N /@ Range[0, 5 Pi, Pi/100];
data = {Map[{#, 3.0*Sin[#]} &, xVals], (* data with "small" maximum y-value *)
   Map[{#, 10.0*Sin[# + Pi/10]} &, xVals], (* data with "small" maximum y-value *)
   Map[{#, 300.0*Cos[#]} &, xVals] (* data with "large" maximum y-value *)
   };

(* Find maximum y-value of each set of data. *)
dataMaxes = Map[Max[#[[All, 2]]] &, data];
Print["dataMaxes = ", dataMaxes];

(* ListPlot each set of data separately (i.e., data[[i]] where i is 1, 2, or 3);
use Grid[] to display the plots side by side. *)
Grid[{
  Table[
   ListPlot[data[[i]], Joined -> True, Frame -> True,
    FrameLabel -> {"x", "y"},
    PlotRange -> All
    ]
   , {i, 1, Length[data]}]
  }]
dataMaxes = {3.,10.,300.}
In the code above, I set PlotRange -> All inside ListPlot. But suppose I wish to set PlotRange conditionally.
Specifically, I wish to set PlotRange -> 50.0 when the maximum y-value is greater than or equal to 50.0, and PlotRange -> All otherwise.
I thought I could accomplish this by using an If statement like If[dataMaxes[[i]] >= 50, 50.0, All]. But the following code generates an error:
(* METHOD 1: gives error *)
(* If dataMaxes[[i]] >= 50.0, use PlotRange -> 50.0; otherwise, use PlotRange -> All. *)
Grid[{
  Table[
   ListPlot[data[[i]], Joined -> True, Frame -> True,
    FrameLabel -> {"x", "y"},
    PlotRange -> If[dataMaxes[[i]] >= 50, 50.0, All]
    ]
   , {i, 1, Length[data]}]
  }]
Flatten::normal: Nonatomic expression expected at position 1 in Flatten[$Failed].
I thought that this error may have to do with placing the If statement directly in the option value for PlotRange, so I tried instead determining the option value before calling ListPlot. The following two methods work well:
(* METHOD 2: works *)
Grid[{
  Table[
   myPlotRange = If[dataMaxes[[i]] >= 50, 50.0, All];
   ListPlot[data[[i]], Joined -> True, Frame -> True,
    FrameLabel -> {"x", "y"},
    PlotRange -> myPlotRange
    ]
   , {i, 1, Length[data]}]
  }]
(* METHOD 3: works *)
myPlotRanges = Map[If[# >= 50, 50.0, All] &, dataMaxes];
Grid[{
  Table[
   ListPlot[data[[i]], Joined -> True, Frame -> True,
    FrameLabel -> {"x", "y"},
    PlotRange -> myPlotRanges[[i]]
    ]
   , {i, 1, Length[data]}]
  }]
Why is it that Method 1 fails, but Methods 2 and 3 work? PlotRange has the attributes Protected and ReadProtected, but nothing else (including HoldAll):
Attributes[PlotRange]
{Protected, ReadProtected}


ListPlotare the governing ones, not those ofPlotRange. However, they're not the issue. (Well, there isn't issue when I test, as I said.) $\endgroup$