3
$\begingroup$

How to optimize the tangent equation of a curve at a certain point as follows:

How to draw the images of the original function, derivative function and tangent equation into the same coordinate system?

ClearAll["`*"]
f[x_] := Log[1 + x] + x E^-x
g[x_] := D[f[x], x] // FullSimplify
point = {0, f[0]}
point[[1]]
k = D[f[x], x] /. x -> point[[1]]
y - point[[2]] == k (x - point[[1]])
Plot[{f[x], g[x],%}, {x, -1, 2}]

Update 1:

f[x_] = Log[1 + x] + x E^-x;
point = {0, f[0]}
k = D[f[x], x] /. x -> point[[1]]
y - point[[2]] == k (x - point[[1]])
Plot[{f[x], f'[x]}, {x, -1, 4}, 
 Epilog -> {Red, 
   InfiniteLine[{x, f[x]}, D[{x, f[x]}, x]] /. x -> point[[1]]}, 
 PlotLabels -> "Expressions", AspectRatio -> 1]

Update 2:

Clear[f, expr];
f[x_] = Log[1 + x] + x E^-x;
point = {2, f[2]}
k = D[f[x], x] /. x -> point[[1]]
y - point[[2]] == k (x - point[[1]])
expr = {f[x], f'[x], f[x0] + f'[x0] (x - x0) /. x0 -> point[[1]]} // 
   Evaluate;
Plot[expr, {x, -1, 7}, AspectRatio -> 1, 
 PlotLabels -> Thread[{"f(x)", "f'(x)", "y"} == expr], 
 ImageSize -> Full]

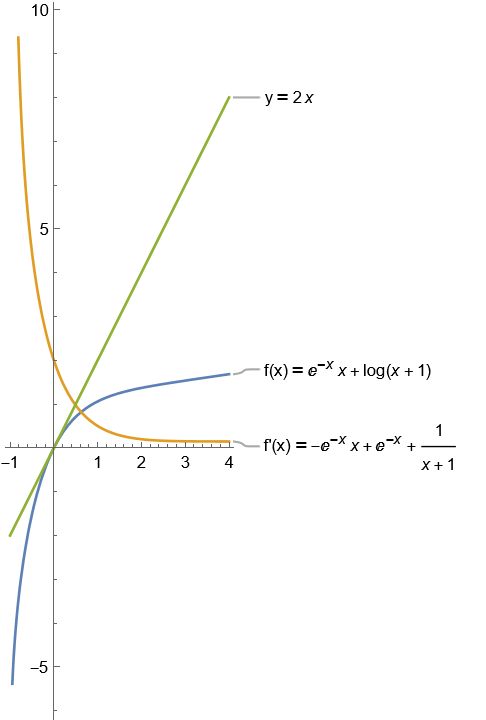
Update 3

Clear[f, expr];
f[x_] = Log[1 + x] + x E^-x; point = {0, f[0]} 
k = D[f[x], x] /. x -> point[[1]]
 y - point[[2]] == k (x - point[[1]]) 
expr = {f[x], f'[x], f[x0] + f'[x0] (x - x0) /. x0 -> point[[1]]} // 
  Evaluate; 
Plot[expr, {x, -1, 7}, 
 Epilog -> {Red, PointSize[0.02], Point[point], 
   Text[point, point, {-2, 1}]}, AspectRatio -> 1, 
 PlotLabels -> Thread[{"f(x)", "f'(x)", "y"} == expr], 
 ImageSize -> 500]

Update 4:

Clear[f, expr];
f[x_] = Log[x] + E^(x - 1);
point = {1, f[1]} 
k = D[f[x], x] /. x -> point[[1]]
 y - point[[2]] == k (x - point[[1]]) 
expr = {f[x], f'[x], 
   f[x0] + f'[x0] (x - x0) /. x0 -> point[[1]] // FullSimplify} // 
  Evaluate; Plot[expr, {x, -1, 7}, 
 Epilog -> {Red, PointSize[0.02], Point[point], 
   Text[point, point, {-2, 1}]}, AspectRatio -> 1, 
 PlotLabels -> Thread[{"f(x)", "f'(x)", "y"} == expr], 
 ImageSize -> 500]
$\endgroup$
4
  • 1
    $\begingroup$ What exactly do you mean by optimizing? Also, your choice of tags is befuddling $\endgroup$
    – bmf
    Commented Feb 24, 2023 at 10:39
  • $\begingroup$ What about Normal[Series[f[x], {x, x0, 1}]] ? $\endgroup$ Commented Feb 24, 2023 at 10:41
  • $\begingroup$ How to draw the images of the original function, derivative function and tangent equation into the same coordinate system? $\endgroup$
    – csn899
    Commented Feb 24, 2023 at 10:42
  • 1
    $\begingroup$ f[x],f'[x]need one argument x but tangent equation needs two arguments x,x0! That's why it's necessary to choose x0 before plotting $\endgroup$ Commented Feb 24, 2023 at 10:44

2 Answers 2

5
$\begingroup$

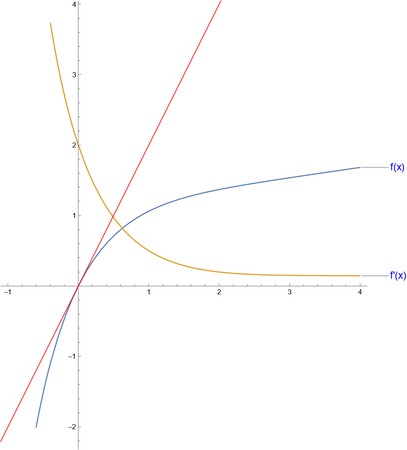
Edit

Clear[f,expr];
f[x_] = Log[1 + x] + x E^-x;
expr = {f[x], f'[x], f[x0] + f'[x0] (x - x0) /. x0 -> 0} // Evaluate;
Plot[expr, {x, -1, 4}, AspectRatio -> Automatic, 
 PlotLabels -> Thread[{"f(x)", "f'(x)", "y"} == expr]]

enter image description here

Original

Clear[f];
f[x_] = Log[1 + x] + x E^-x;
Plot[{f[x], D[f[x], x]} // Evaluate, {x, -1, 4}, 
 Epilog -> {Red, InfiniteLine[{x, f[x]}, D[{x, f[x]}, x]] /. x -> 0}, 
 AspectRatio -> Automatic, 
 PlotLabels -> {Style["f(x)", 14, Blue], Style["f'(x)", 14, Blue]}]

enter image description here

$\endgroup$
8
  • $\begingroup$ (+1) but it should be f[x_] = Log[1 + x] + x E^-x; Plot[Evaluate[{f[x], D[f[x], x]}], {x, -1, 4}, Epilog -> {Red, InfiniteLine[{x, f[x]}, D[{x, f[x]}, x]] /. x -> 0}] In the OP it is stated the function, its derivative and the tangent line :-) $\endgroup$
    – bmf
    Commented Feb 24, 2023 at 10:56
  • $\begingroup$ PlotLabels -> "Expressions"Plus, why can't the complete function analytic expression be displayed next to each curve in the image? How to display tangent equations next to tangents $\endgroup$
    – csn899
    Commented Feb 24, 2023 at 11:02
  • $\begingroup$ Can I display the complete analytical formula of the function next to the curve? And f (x)=......, $\endgroup$
    – csn899
    Commented Feb 24, 2023 at 11:10
  • $\begingroup$ The tangent equation should be y==2x $\endgroup$
    – csn899
    Commented Feb 24, 2023 at 11:25
  • 1
    $\begingroup$ @csn899 Clear[f, expr]; f[x_] = Log[1 + x] + x E^-x; point = {0, f[0]}; k = D[f[x], x] /. x -> point[[1]] y - point[[2]] == k (x - point[[1]]); expr = {f[x], f'[x], f[x0] + f'[x0] (x - x0) /. x0 -> point[[1]]} // Evaluate; Plot[expr, {x, -1, 7}, Epilog -> {Red, PointSize[0.02], Point[point], Text[point, point, {-1, 1}]}, AspectRatio -> Automatic, PlotLabels -> Thread[{"f(x)", "f'(x)", "y"} == expr], ImageSize -> 400] $\endgroup$
    – cvgmt
    Commented Feb 25, 2023 at 0:18
4
$\begingroup$

Maybe I am missing something, but I don't see what.

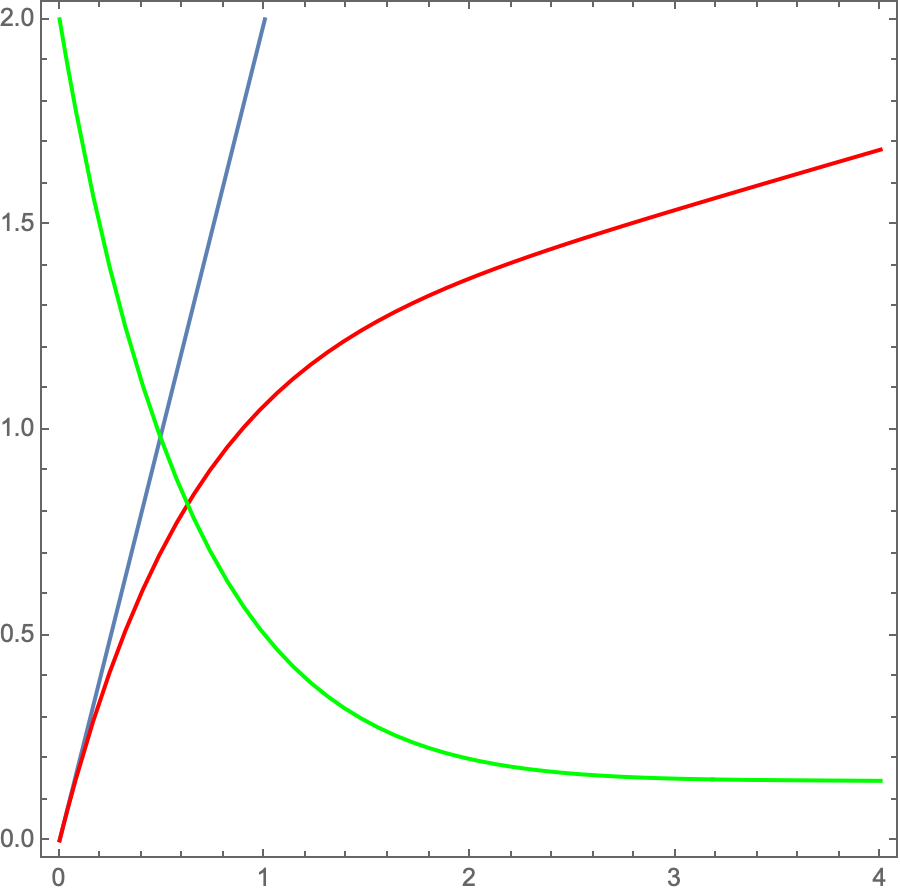
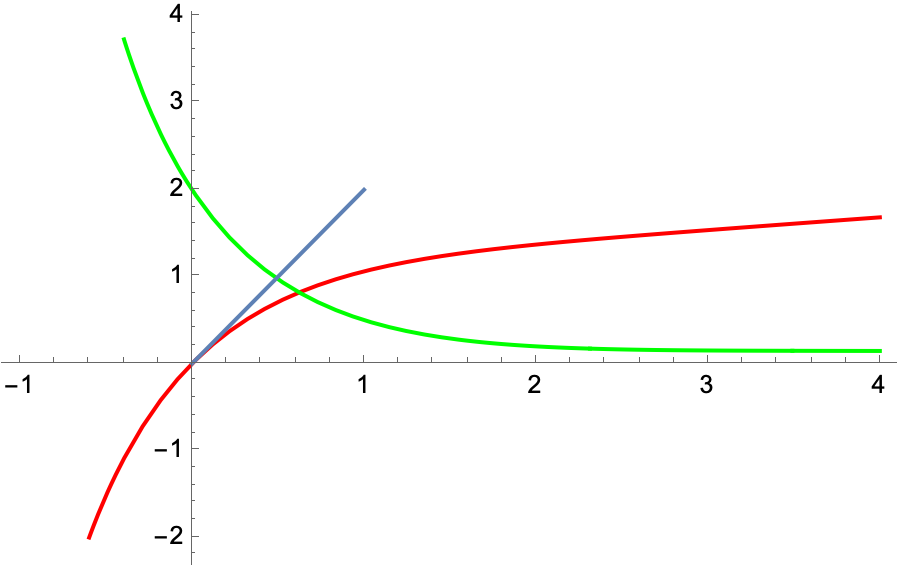
Anyway, with a minimal amendment of the code in the OP we have:

f[x_] := Log[1 + x] + x E^-x
g[x_] := D[f[x], x] // FullSimplify
point = {0, f[0]}
point[[1]]
k = D[f[x], x] /. x -> point[[1]]
p0 = ContourPlot[
   y - point[[2]] == k (x - point[[1]]), {x, 0, 4}, {y, 0, 2}];
p1 = Plot[Evaluate[{f[x], g[x]}], {x, 0, 4}, 
   PlotStyle -> {Red, Green}];
Show[p0, p1]
Show[p1, p0]

plot

p2

$\endgroup$

Your Answer

By clicking “Post Your Answer”, you agree to our terms of service and acknowledge you have read our privacy policy.

Not the answer you're looking for? Browse other questions tagged or ask your own question.