0
$\begingroup$

So I am playing around with an interpolation polynomial. The code for what I am trying to do is computationally heavy:

p[x_, n_]:=Sum[f[Table[15*(k/n),{k,0,n}][[i]]]*Product[Piecewise[{{(x-Table[15*(k/n),{k, 0, n}][[j]])/(Table[15*(k/n),{k,0,n}][[i]]-Table[15*(k/n),{k,0,n}][[j]]),Not[i==j]},{1,i == j}}],{j,1,Length[Table[15*(k/n),{k,0,n}]]}],{i,1,Length[Table[15*(k/n),{k,0,n}]]}];

Or in math because that code looks unreadable:

$$p(x,n):=\left\{ \sum^{n}_{i=0}\left( f(x_i)\left(\prod_{j\neq i}\frac{x-x_j}{x_i-x_j} \right) \right) : i,j\in \mathbb{Z}^{+}_{n} \ \ and\ \ \left\{x_i \right\}_{i=0}^{n}= \frac{15*i}{n} \right\}$$

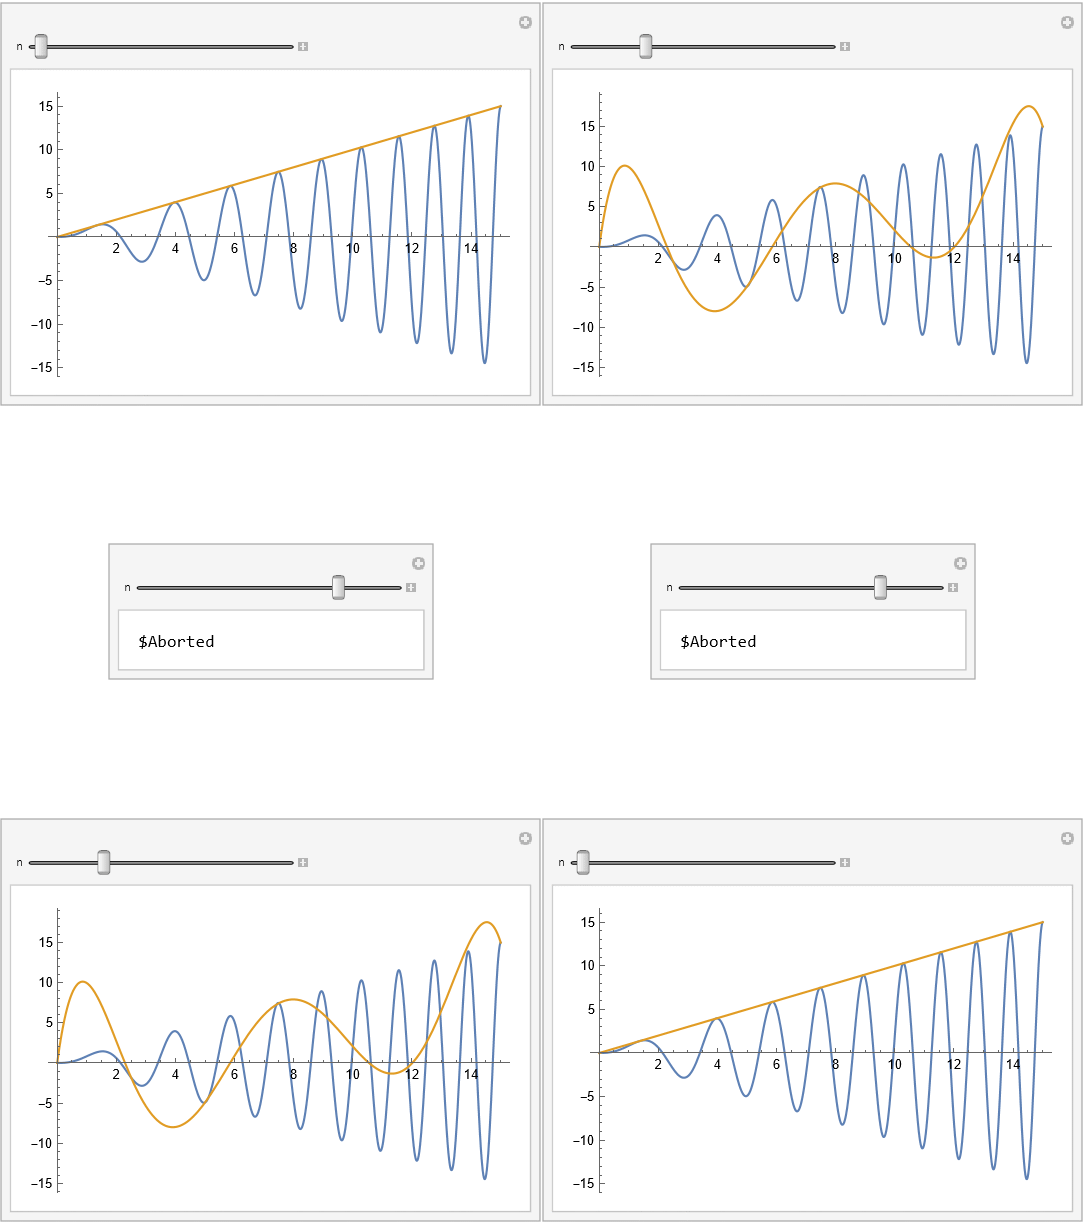
I want to export this as a gif up to $n=20$. Unfortunately, I get $Aborted around $n=16$.

Exported .gif file

So now my question: Is there any way I can get Mathematica to not abort?

As always, I appreciate any and all help.

EDIT: I received a comment to include all my code so below is the code I excluded initially:

f[x_]=x*Sin[x^(1.5)]; Export[“coolthing.gif”,Manipulate[Plot[{f[x],p[x,n]},{x,0,15}],{n,1,20}],”GIF”];

$\endgroup$
3
  • 4
    $\begingroup$ Please edit your question to include the definition f, and the command that aborts. $\endgroup$
    – user293787
    Commented Oct 22, 2022 at 3:40
  • $\begingroup$ @user293787 As requested, see the edit at the bottom of the post. $\endgroup$
    – Chloe
    Commented Oct 22, 2022 at 19:22
  • 1
    $\begingroup$ I think it would be polite to warn users when a computation takes a long time. $\endgroup$
    – Michael E2
    Commented Oct 22, 2022 at 20:16

1 Answer 1

6
$\begingroup$

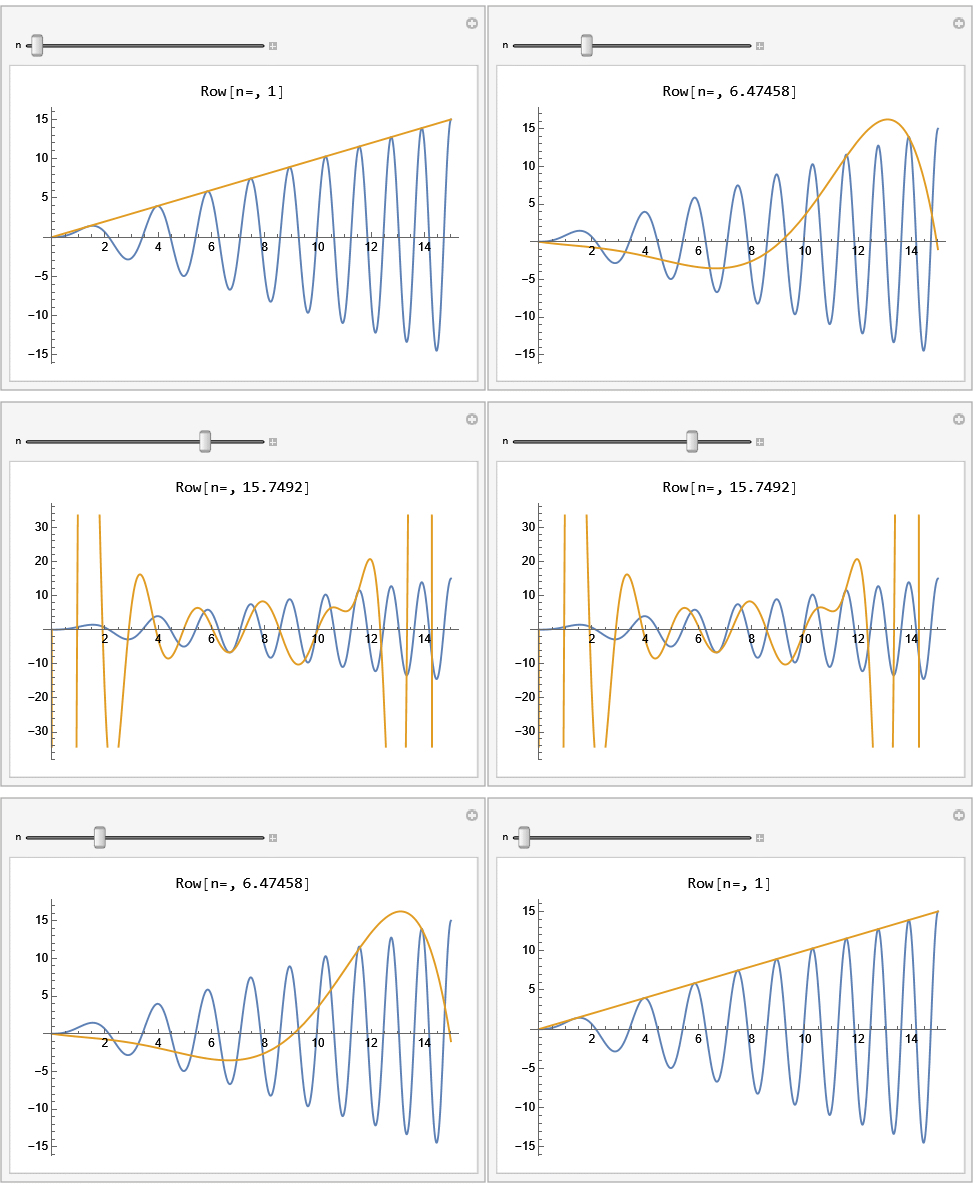
Try this

enter image description here

Using the following code below. Btw, there are better ways to make animated gif files from Manipulate, by saving into a table each frame, then export these frames one by one at the end. You can also have more control on time between frames. If you search this site, you will see examples.

It now also runs faster, since the functions are defined to take in numeric arguments. On my PC this finished in about 3 minutes.

I also added SetOptions[$FrontEnd,DynamicEvaluationTimeout->60] just in case you need more than 6 seconds, but it probably not needed now. Also it is good to add TrackedSymbols :> {n}, SynchronousUpdating -> False, ContinuousAction -> False so I added these also.

SetDirectory[NotebookDirectory[]]
SetOptions[$FrontEnd, DynamicEvaluationTimeout -> 60]
p[x_?NumericQ, n_?NumericQ] := 
  Sum[f[Table[15*(k/n), {k, 0, n}][[i]]]*
    Product[Piecewise[{{(x - 
           Table[15*(k/n), {k, 0, n}][[j]])/(Table[
             15*(k/n), {k, 0, n}][[i]] - 
           Table[15*(k/n), {k, 0, n}][[j]]), Not[i == j]}, {1, 
        i == j}}], {j, 1, Length[Table[15*(k/n), {k, 0, n}]]}], {i, 1,
     Length[Table[15*(k/n), {k, 0, n}]]}];

f[x_?NumericQ] := x*Sin[x^(15/10)];

Export["coolthing.gif", Manipulate[
  Grid[{{Row["n=", n]},
    {Plot[{f[x], p[x, n]}, {x, 0, 15}]}}
   ],
  {n, 1, 20}, TrackedSymbols :> {n}, SynchronousUpdating -> False, 
  ContinuousAction -> False
  ],
 "GIF"]

Update

Here is a version for $n=40$. It took 30 minutes on my PC and I had to increase SetOptions[$FrontEnd,DynamicEvaluationTimeout->200] also
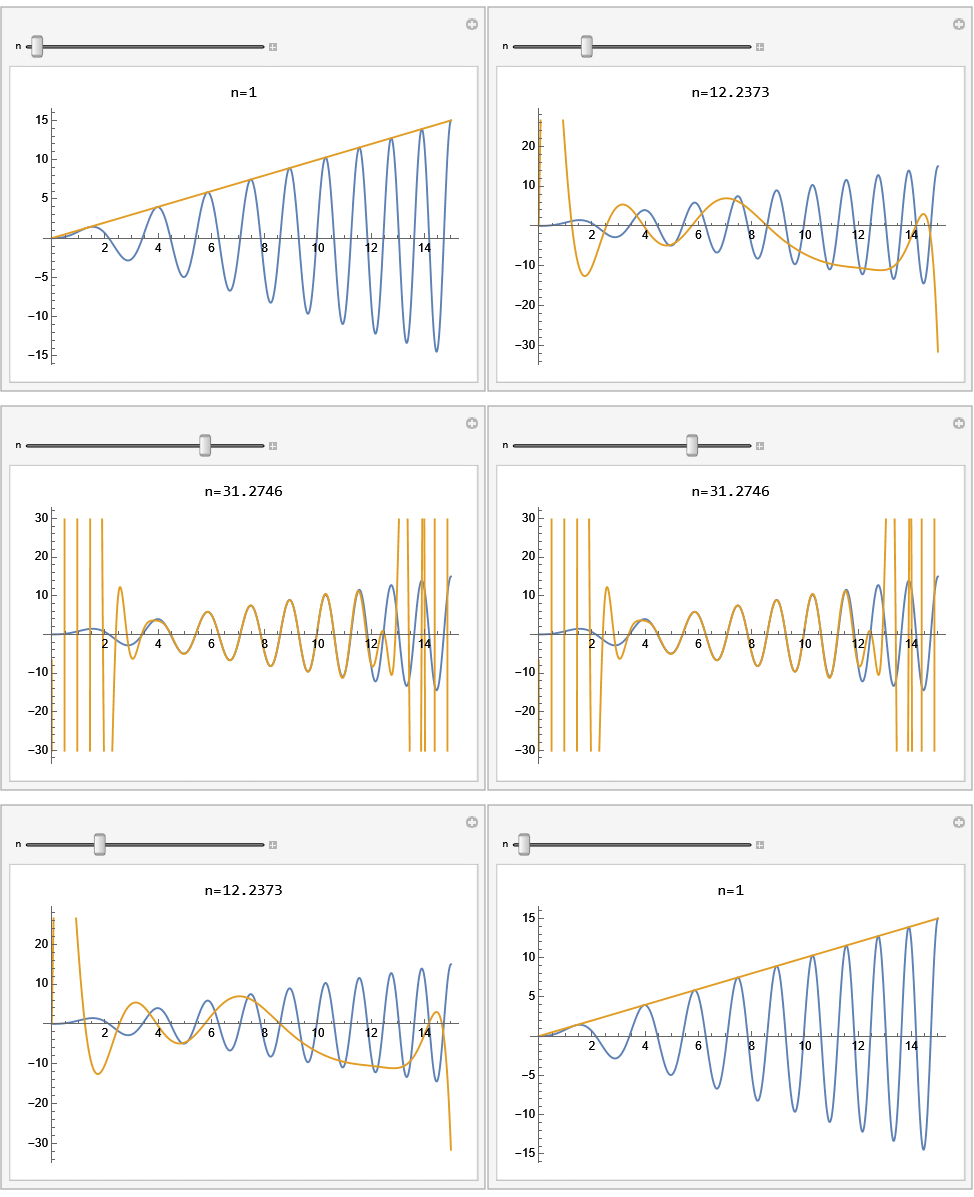
enter image description here

Export["coolthing.gif", Manipulate[
  Grid[{{Row[{"n=", n}]},
    {Plot[{f[x], p[x, n]}, {x, 0, 15}]}}
   ],
  {n, 1, 40}, TrackedSymbols :> {n}, SynchronousUpdating -> False, 
  ContinuousAction -> False
  ],
 "GIF"]

Update

per comments, made $n$ integer values and fixed the vertical scale to some values. OP can decide better what these should be.

Export["coolthing.gif",
 Manipulate[
  Grid[{{Row[{"n=", n}]},
    {Plot[{f[x], p[x, n]},
      {x, 0, 15}, PlotRange -> {Automatic, {-40, 40}}]}}
   ],
  {{n, 1, "n"}, 1, 40, 1, Appearance -> "Labeled"},
  TrackedSymbols :> {n},
  SynchronousUpdating -> False,
  ContinuousAction -> False
  ],
 "GIF"]
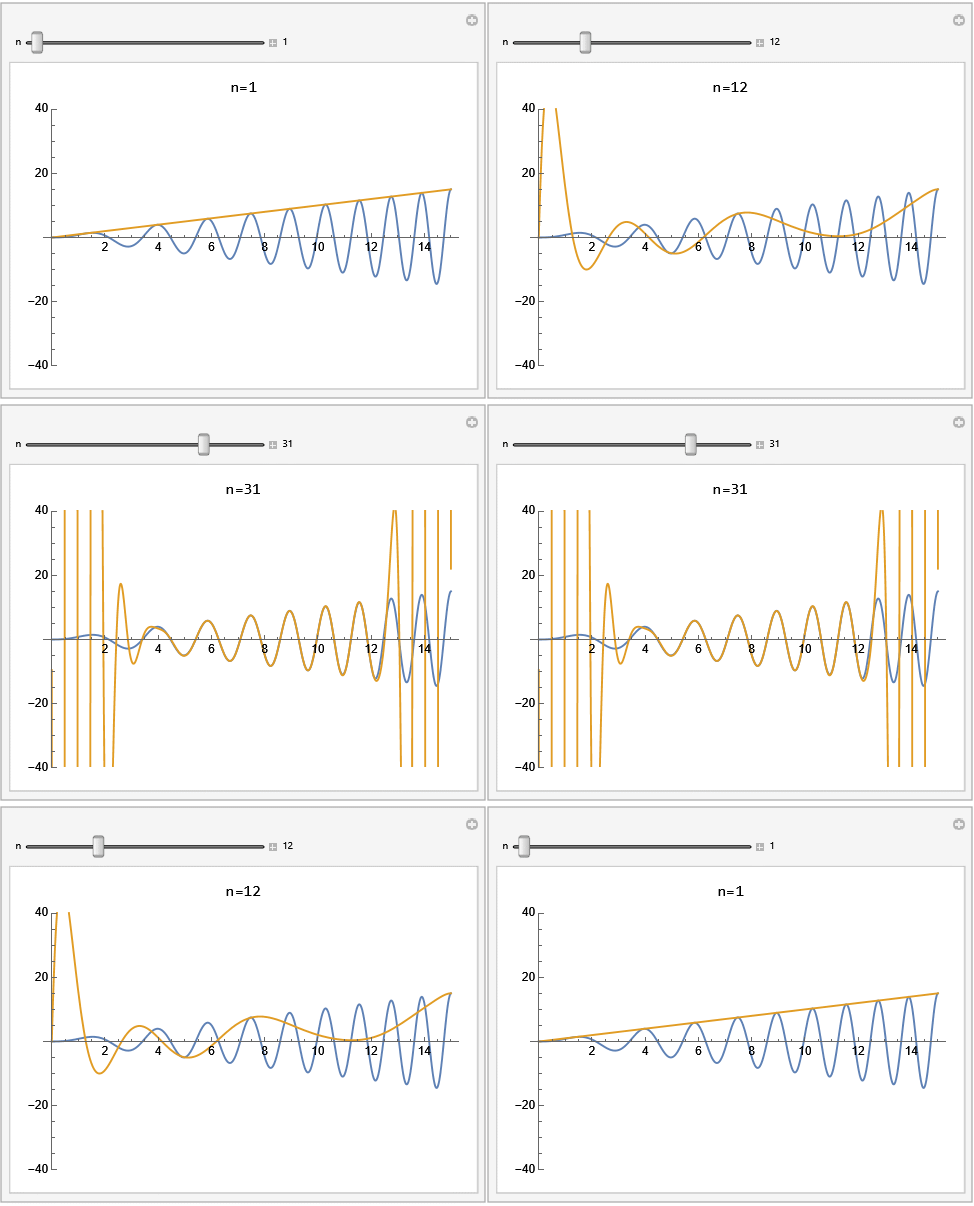
enter image description here

$\endgroup$
8
  • $\begingroup$ Maybe fix the range of the y-axis to make it look more peaceful? $\endgroup$
    – user293787
    Commented Oct 23, 2022 at 3:58
  • $\begingroup$ Also, maybe restrict n to be an integer? $\endgroup$
    – user293787
    Commented Oct 23, 2022 at 4:09
  • 1
    $\begingroup$ @user293787 fyi, updated. OP can better fine tune these things as I was just using their code as is. $\endgroup$
    – Nasser
    Commented Oct 23, 2022 at 15:59
  • $\begingroup$ I think it looks better this way. Cannot upvote again since already did earlier ;-) $\endgroup$
    – user293787
    Commented Oct 23, 2022 at 16:00
  • 1
    $\begingroup$ @user293787 the vertical scale can go as high as many thousands and then the original plot can no longer be seen so I set it at -40..40. I do not know anything about what the code is doing, other than it is very slow. $\endgroup$
    – Nasser
    Commented Oct 23, 2022 at 16:02

Your Answer

By clicking “Post Your Answer”, you agree to our terms of service and acknowledge you have read our privacy policy.

Not the answer you're looking for? Browse other questions tagged or ask your own question.