0
$\begingroup$

I have a discrete dataset data of the form {10524, 2} where I have in the first row the {x,y,z} coordinates and in the second row the evaluation f[x,y,z]. The points are not dense, in that sense, that I kept only some points of $f$ above a bound.

Ignoring $f$ I can do that with ListPointPlot3D[data[[;; , 1]]] however I don't see then, when the function is really large.

Is there a Colouring-Option or a totally different Plot-Option similar to perhaps DensityPlot3D?

So a minimal example,

data = {{{0, 0, 0}, 1}, {{0, 1, 1}, 2}, {{0, 2, 1}, 3}}
ListPointPlot3D[data[[;; , 1]]]

And I want to see the difference between $1,2,3$

Thanks alot in advance

EDIT2: I now found C ListDensityPlot3D` which works for

data2 = {{0, 0, 0, 1}, {0, 1, 1, 2}, {0, 2, 1, 3}, {1, 2, 3, 4}, {0, 
   1, 0, 5}}
ListDensityPlot3D[data2]

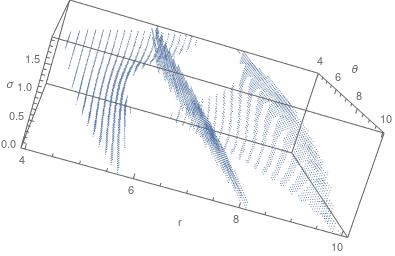
but not doing a picture for my real data2 containing 5000 points, see a ListPointPlot3D below enter image description here
$\endgroup$
6
  • $\begingroup$ Possible duplicate: (20023) and other related: [1,2,3,4] $\endgroup$
    – Michael E2
    Commented Aug 4, 2021 at 16:27
  • 1
    $\begingroup$ The reason that ListDensityPlot3D doesn't work on data2 is that it requires the x, y, z coordinates to make up a rectangular array (though the error message generated could be clearer about this.) Try data3 = Flatten[Table[{i, j, k, i + j + k}, {i, 0, 2}, {j, 0, 2}, {k, 0, 2}], 2]; ListDensityPlot3D[data3] for a version that does work. $\endgroup$ Commented Aug 11, 2021 at 15:01
  • 2
    $\begingroup$ It looks like ListDensityPlot3D requires at least 5 data points: data2 = {{0, 0, 0, 1}, {0, 1, 1, 2}, {0, 2, 1, 3}, {1, 1, 1, 4}, {-1, 1, 1, 3}}; ListDensityPlot3D[data2] works for me, despite not being a rectangular array (contrary to what @MichaelSeifert suggested) $\endgroup$
    – Lukas Lang
    Commented Aug 11, 2021 at 15:06
  • 1
    $\begingroup$ @LukasLang: I stand corrected! I was going off the line in the documentation that says "array should be an array of real numbers; positions where array is not a real number are rendered transparently". But on closer inspection this appears to refer to a different usage of ListDensityPlot3D (the usage without coordinates.) $\endgroup$ Commented Aug 11, 2021 at 15:14
  • 1
    $\begingroup$ This gives a nice visualization of the sample data2, which is quite special since the data is contained in a plane (and mathematically is actually 3D not 4D): data3 = Join[data2, # - {1, 0, 0, 0} & /@ data2, # + {1, 0, 0, 0} & /@ data2]; cfn = "DefaultColorFunction" /. (Method /. ChartingResolvePlotTheme[Automatic, ListSliceDensityPlot3D]) // ColorData; With[{range = MinMax[data3[[All, -1]]]}, ListSliceDensityPlot3D[data3, {"XStackedPlanes", {0.}}, ColorFunction -> (cfn[Rescale[#, range, {0, 1}]] &), ColorFunctionScaling -> False]]` $\endgroup$
    – Michael E2
    Commented Aug 11, 2021 at 17:20

1 Answer 1

5
$\begingroup$
$Version

(* "12.3.1 for Mac OS X x86 (64-bit) (June 19, 2021)" *)

Clear["Global`*"]

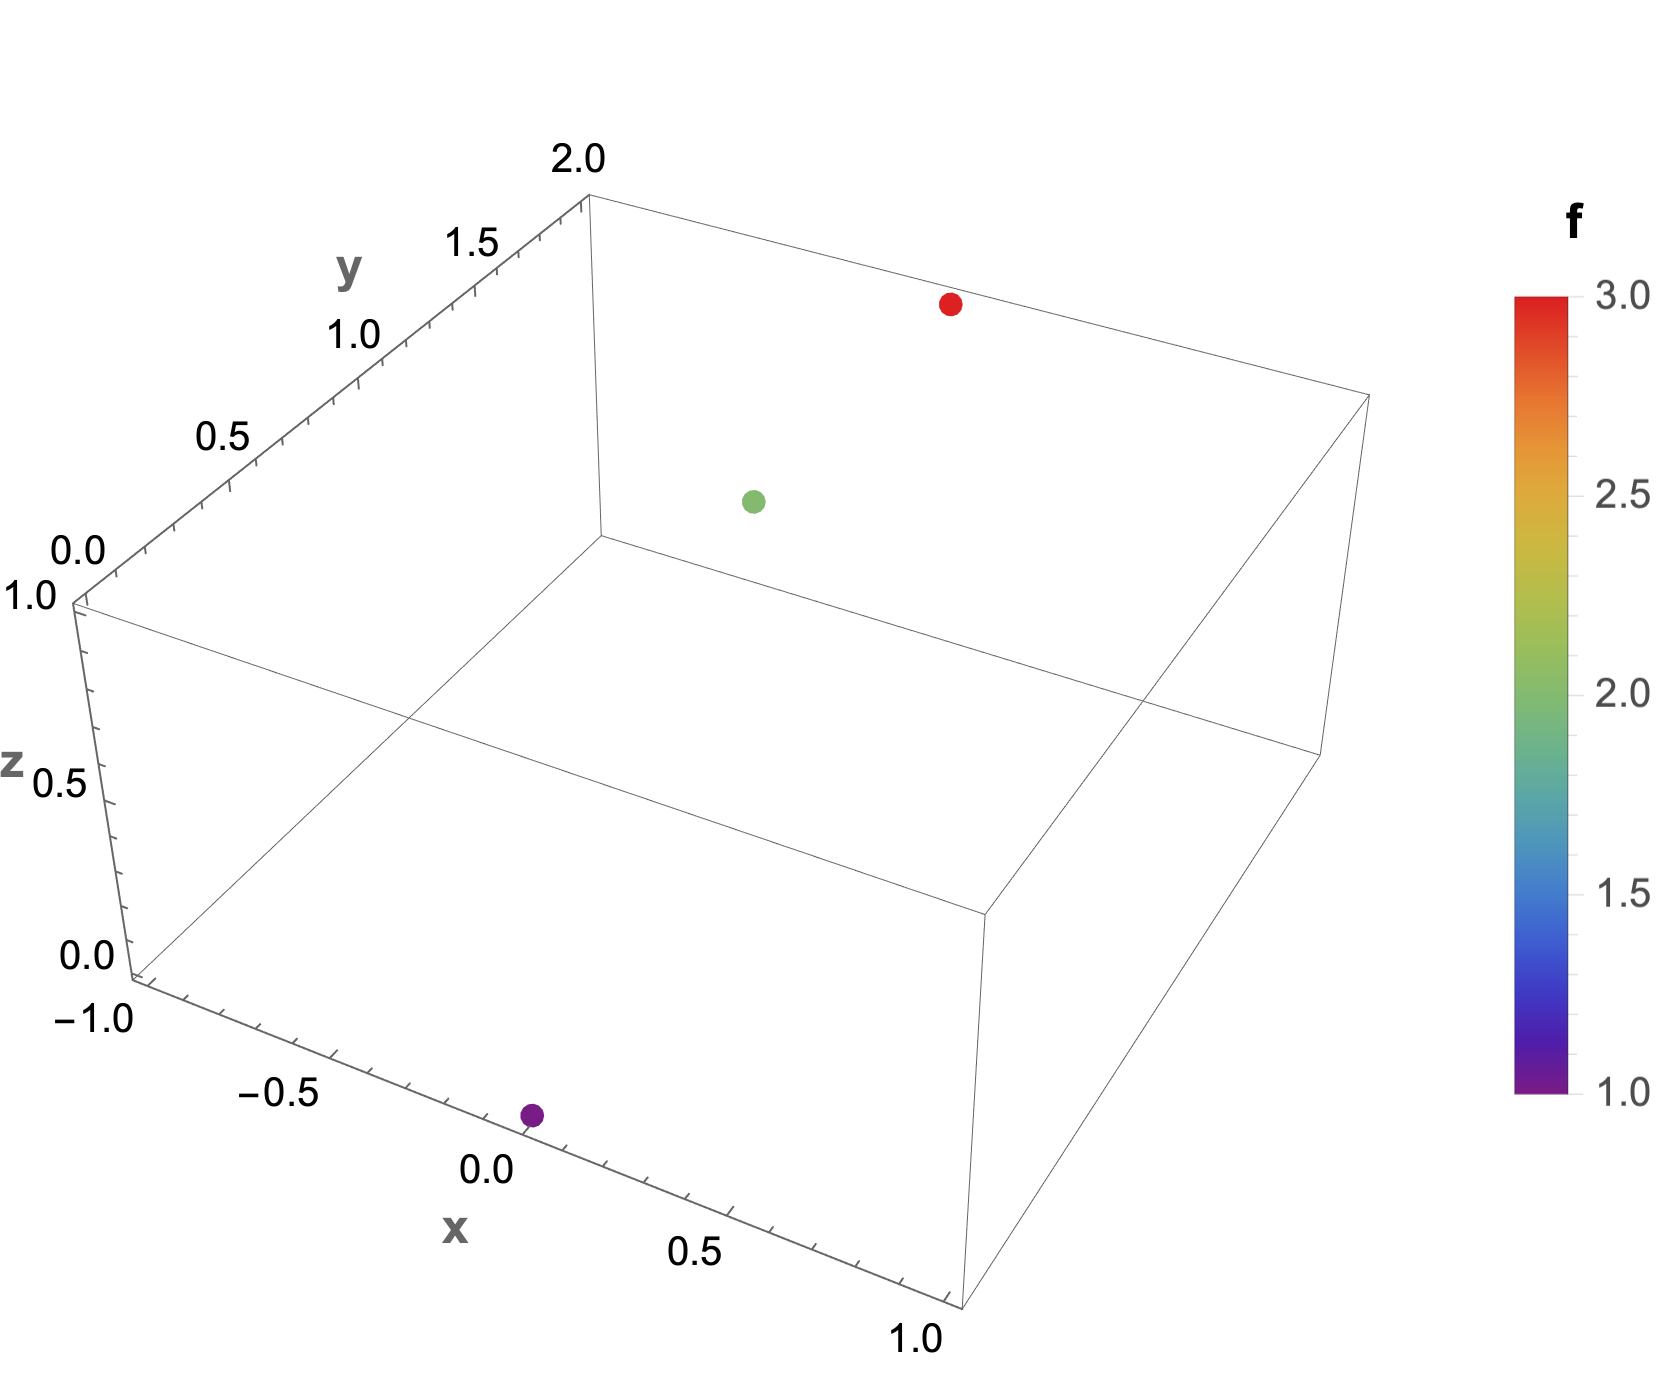
data = {{{0, 0, 0}, 1}, {{0, 1, 1}, 2}, {{0, 2, 1}, 3}};

{fmin, fmax} = MinMax[data[[All, 2]]]

(* {1, 3} *)

Legended[
 Graphics3D[
  {AbsolutePointSize[6],
   {ColorData["Rainbow"][Rescale[#[[2]], {fmin, fmax}]],
      Point[#[[1]]]} & /@ data},
  Axes -> True,
  AxesLabel -> (Style[#, 12, Bold] & /@
     {"x", "y", "z"})],
 BarLegend[{"Rainbow", {fmin, fmax}},
  LegendLabel -> Style["f", 12, Bold]]]

enter image description here

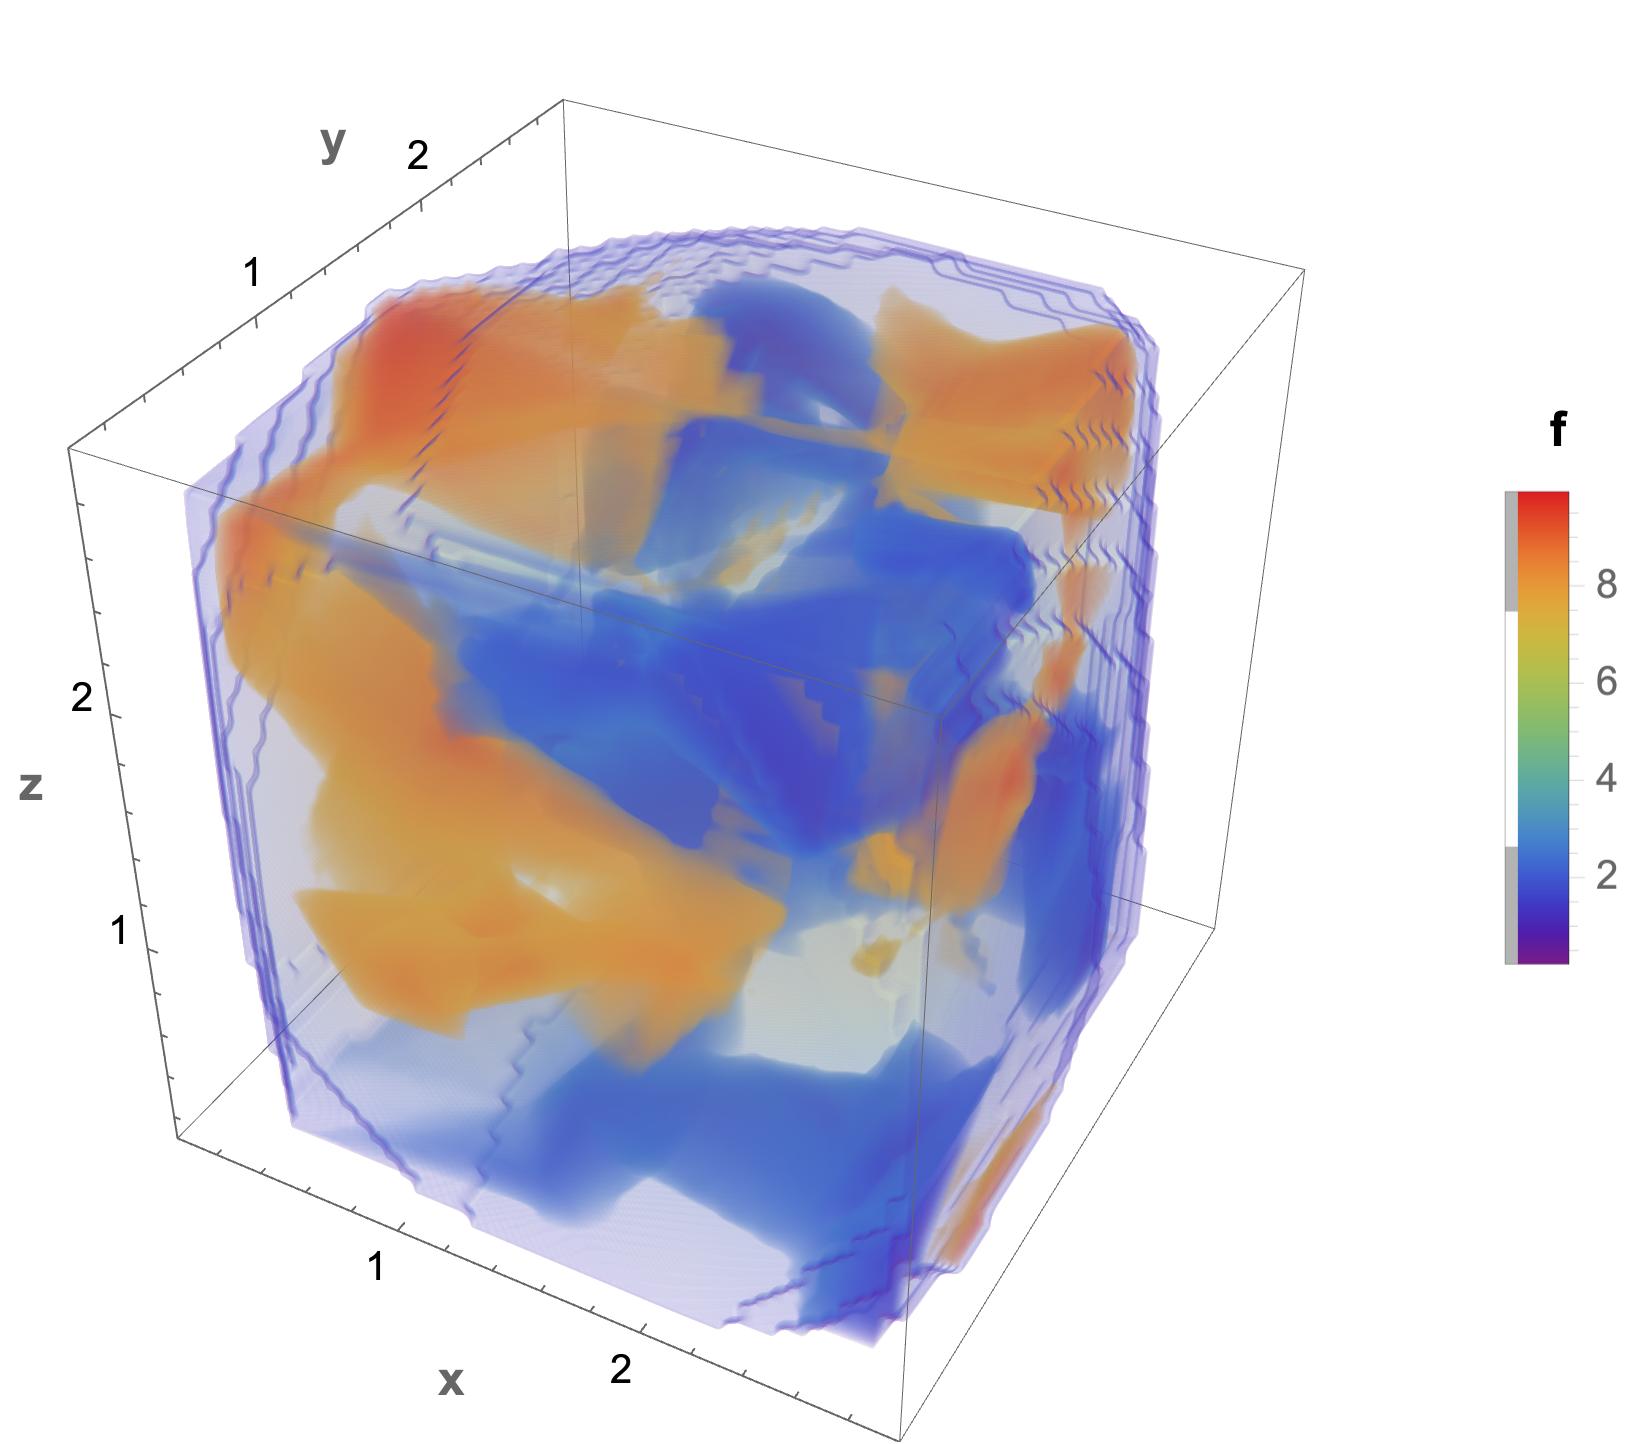
EDIT: ListDensityPlot3D works if the data is structured as ListDensityPlot3D[{{x1, y1, z1, f1}, {x2, y2, z2, f2},…}] and there are sufficient number of points. However, "ListDensityPlot3D linearly interpolates values so as to give color changes" and "ListDensityPlot3D is mainly intended for continuous values." Since you describe your data as "discrete" and "not dense" it may not be a good fit to this form of visualization. However, without representative data it is difficult to say.

Clear["Global`*"]

SeedRandom[1234];

data2 = Flatten /@ Table[{RandomReal[{0, 3}, 3], RandomReal[10]}, {200}];

ListDensityPlot3D[data2,
 AxesLabel ->
  (Style[#, 12, Bold] & /@ {"x", "y", "z"}),
 ColorFunction -> "Rainbow",
 PlotLegends -> BarLegend[Automatic,
   LegendLabel -> Style["f", 12, Bold]]]

enter image description here

$\endgroup$
2
  • $\begingroup$ Hey Bob, thanks alot! will try your code on my big dataset, any idea why ListDensityPlot3D doesn't work? $\endgroup$ Commented Aug 11, 2021 at 14:43
  • $\begingroup$ Dear Bob, thanks again for your detailed answer. I understand now that ´data2´ does not contain enough points, however weirdly enough my "real" data2 contains 5000 points and is the discretisation of a manifold, the long time behavior of a PDE, unweighted in ListPoint3D it loos fine and like something easy to interpolate. I'll add it just for information in the main post and will play around with your codes, thank you again very much $\endgroup$ Commented Aug 12, 2021 at 10:17

Your Answer

By clicking “Post Your Answer”, you agree to our terms of service and acknowledge you have read our privacy policy.

Not the answer you're looking for? Browse other questions tagged or ask your own question.