I have some data as:
data={38.5286,38.3771,38.1375,36.2215,35.5168,35.5106,34.821,34.4819,34.1321,33.7647,33.5369,32.8756,32.8502,32.6769,32.5624,32.4046,31.4334,31.1738,30.7002,30.2592,30.2444,30.1869,29.5221,29.4132,29.304,29.2167,29.1548,29.1548,28.7772,28.6366,28.5317,28.4121,28.4038,28.3335,28.2843,27.9732,27.8936,27.7218,27.5,26.6693,26.6552,26.4365,26.25,25.7304,25.3032,25.2746,24.9944,23.9467,21.006,19.4551,18.3424,17.5895,17.442,15.0271}
I want to numerically calculate the integral: $S = - \int dx p(x) \ln p(x)$, where $p(x)$ is the probability density function. This integral is also called the entropy of distribution.
To do so, we define
f = HistogramDistribution[data]
then,
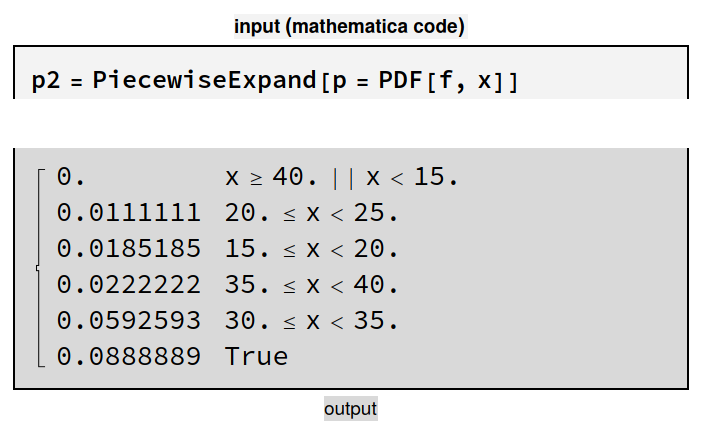
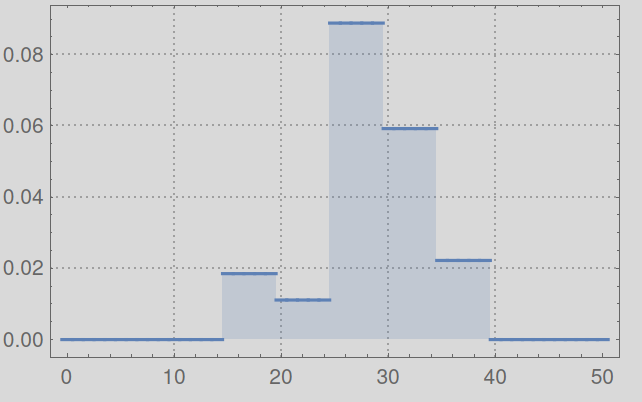
p = PDF[f, x]
Now, we can calculate the integral as
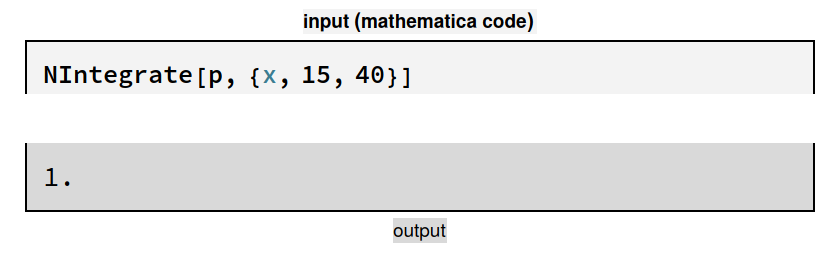
NIntegrate[ -p Log[p], {x,-\[Infinity], \[Infinity]}]
But, why does Mahematica return errors?


